Data Exploration Made Simple: Methods, Examples, and Tools

In today’s data-driven world, organizations rely heavily on data to make informed decisions, predict future trends, and gain a competitive edge. However, raw data alone has little value unless it is properly understood and analyzed. This is where Data-Exploration comes into play. Data exploration is a critical step in the data analysis lifecycle that helps analysts, data scientists, and businesses understand the structure, patterns, and potential issues within a dataset before applying advanced modeling or decision-making techniques.
This comprehensive guide will walk you through the concept of data exploration, its importance, key steps, techniques, tools, and best practices, helping you build a strong foundation for any data-related project.
What is Data Exploration?

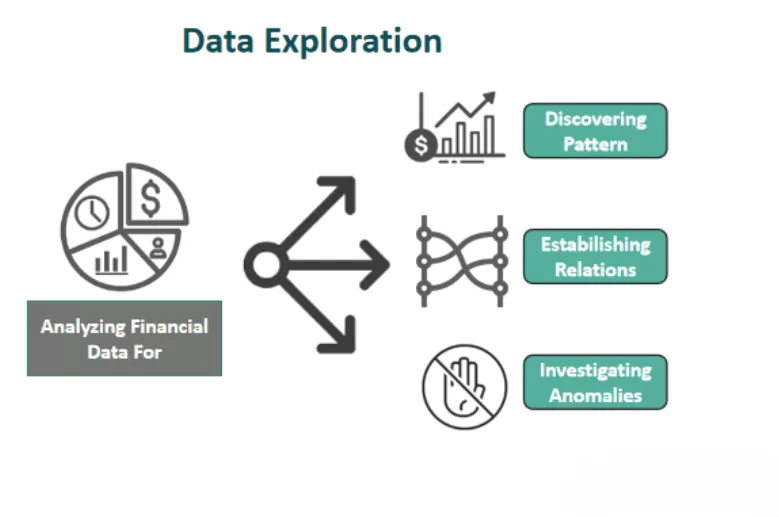
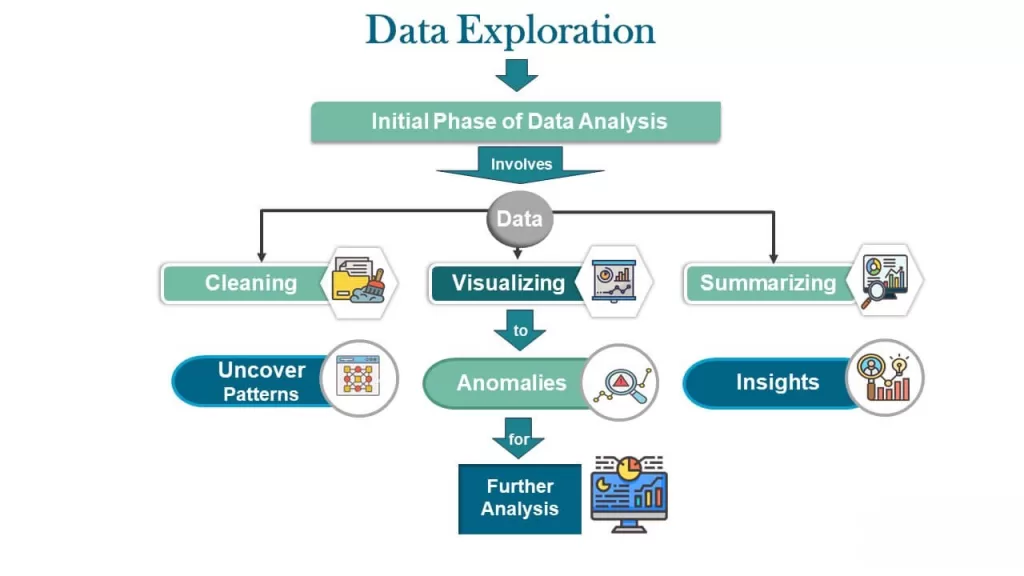
Data Exploration, often referred to as Exploratory Data Analysis (EDA), is the process of examining datasets to summarize their main characteristics, identify patterns, detect anomalies, test assumptions, and check data quality. It uses a combination of statistical methods, visualizations, and logical reasoning to gain insights from data.
Unlike confirmatory analysis, which focuses on testing predefined hypotheses, data exploration is more open-ended. The goal is to ask questions like:
- What does the data look like?
- Are there missing or inconsistent values?
- What relationships exist between variables?
- Are there any outliers or unusual patterns?
Why is Data Exploration Important?
Data exploration plays a vital role in the success of any data analysis or machine learning project. Some key reasons include:
- Improves Data Understanding
It helps analysts become familiar with the dataset, including variable types, distributions, and ranges. - Identifies Data Quality Issues
Missing values, duplicates, inconsistencies, and errors can be detected early. - Reveals Patterns and Trends
Exploration can uncover hidden relationships, correlations, or trends that may not be obvious. - Guides Feature Selection
Understanding variable importance helps in selecting relevant features for modeling. - Prevents Costly Mistakes
Detecting problems early reduces the risk of incorrect conclusions and flawed models.
Data Exploration vs Data Analysis

While often used interchangeably, data exploration and data analysis are not the same:
- Data Exploration focuses on understanding the data, discovering patterns, and generating hypotheses.
- Data Analysis focuses on testing hypotheses, building models, and drawing conclusions.
Data exploration is usually performed before formal data analysis and modeling.
Key Steps in Data Exploration
1. Understanding the Dataset
The first step is to understand the basic structure of the data:
- Number of rows and columns
- Types of variables (numerical, categorical, datetime, text)
- Meaning and context of each feature
- Source of the data and how it was collected
This step often involves reviewing metadata, documentation, or domain knowledge.
2. Data Cleaning and Preparation
Before deep exploration, basic data cleaning is required:
- Handling missing values (removal, imputation, or replacement)
- Removing duplicate records
- Correcting data types
- Standardizing formats (dates, units, categories)
Clean data ensures that insights drawn during exploration are accurate and reliable.
3. Descriptive Statistics
Descriptive statistics provide a numerical summary of the data:
- Measures of central tendency: mean, median, mode
- Measures of dispersion: range, variance, standard deviation
- Distribution metrics: skewness and kurtosis
- Counts and frequencies for categorical variables
These statistics offer a quick overview of how data values are distributed.
4. Data Visualization
Visualization is one of the most powerful aspects of data exploration. It helps identify patterns and anomalies quickly.
Common visualization techniques include:
- Histograms to understand distributions
- Box plots to detect outliers
- Bar charts for categorical data
- Scatter plots to explore relationships between variables
- Heatmaps to analyze correlations
Visual insights often reveal information that numbers alone cannot.
5. Univariate Analysis
Univariate analysis focuses on analyzing a single variable at a time:
- Distribution of a numeric variable
- Frequency of categorical values
- Presence of outliers
- Range and variability
This step helps understand individual variables independently.
6. Bivariate and Multivariate Analysis
- Bivariate analysis examines the relationship between two variables (e.g., correlation between income and spending).
- Multivariate analysis explores interactions among three or more variables.
Techniques include:
- Correlation analysis
- Cross-tabulation
- Pair plots
- Multidimensional visualizations
This step helps identify dependencies and interactions within the dataset.
7. Detecting Outliers and Anomalies
Outliers are data points that significantly differ from others. While some outliers indicate errors, others may represent important insights.
Methods to detect outliers include:
- Box plots
- Z-score analysis
- Interquartile Range (IQR)
- Visualization techniques
Understanding outliers is crucial before deciding whether to remove or retain them.
Common Data Exploration Techniques

Some widely used data exploration techniques are:
- Summary statistics
- Correlation analysis
- Data profiling
- Dimensionality reduction (PCA)
- Clustering for pattern discovery
- Time series analysis (for temporal data)
The choice of technique depends on the data type and project objectives.
Tools Used for Data Exploration

Data exploration can be performed using various tools and programming languages:
Programming Languages
- Python (Pandas, NumPy, Matplotlib, Seaborn)
- R (dplyr, ggplot2, tidyverse)
Data Visualization Tools
- Tableau
- Power BI
- Google Data Studio
Spreadsheet Tools
- Microsoft Excel
- Google Sheets
The tool selection depends on data size, complexity, and user expertise.
Best Practices for Effective Data Exploration
To get the most out of data exploration, follow these best practices:
- Always understand the business or problem context
- Start simple before applying complex techniques
- Use visualizations alongside statistics
- Document findings and assumptions
- Avoid bias by exploring data objectively
- Iterate the process as new insights emerge
Challenges in Data Exploration

Despite its importance, data exploration comes with challenges:
- Large and complex datasets
- Poor data quality
- High-dimensional data
- Time constraints
- Risk of overinterpreting patterns
Awareness of these challenges helps analysts approach exploration more cautiously.
Role of Data Exploration in Machine Learning
In machine learning projects, data exploration is essential for:
- Selecting relevant features
- Understanding target variable behavior
- Identifying data leakage
- Improving model performance
Well-explored data often leads to simpler, more accurate models.
Conclusion
Data exploration is the foundation of any successful data analysis or data science project. It bridges the gap between raw data and meaningful insights by helping analysts understand, clean, and interpret datasets effectively. By combining statistical techniques, visual analysis, and domain knowledge, data exploration ensures that decisions and models are built on solid ground.
Whether you are a beginner stepping into data analytics or an experienced data scientist, mastering data exploration will significantly enhance your ability to extract value from data. Investing time in this stage not only improves accuracy but also builds confidence in the insights you deliver.
Want to learn more ??, Kaashiv Infotech Offers Data Analytics Course, Data Science Course, Cyber Security Course & More Visit Their Website www.kaashivinfotech.com.