

R is a popular programming language used for statistical computing, data analysis, data visualization, machine learning, and research. It is widely used in industries such as healthcare, finance, education, business analytics, and scientific research. Students who learn R can improve their programming skills while gaining practical experience in analyzing real-world datasets.
Working on projects is one of the best ways to understand R programming. Instead of learning only syntax and functions, projects help students apply data manipulation, visualization, statistical analysis, and problem-solving techniques.
Here are eight unique R project ideas suitable for beginners, intermediate learners, and students looking to build a portfolio.
1. Student Performance Analysis

Student Performance Analysis is a beginner-friendly R project that helps analyze academic results and identify factors affecting students’ performance.
The project collects student information such as attendance, study hours, assignment scores, examination marks, and extracurricular activities. Using R, students can explore the dataset and understand how different factors influence academic results.
Technologies used:
- R Programming
- RStudio
- ggplot2
- dplyr
- CSV datasets
Key features:
- Calculate average marks for each student.
- Compare subject-wise performance.
- Analyze attendance and examination results.
- Identify students who require additional support.
- Create charts showing academic trends.
Students can use bar charts, histograms, scatter plots, and heatmaps to visualize academic performance. This project helps beginners understand data cleaning, data visualization, descriptive statistics, and basic correlation analysis.
2. Sales Data Analysis and Forecasting
Sales Data Analysis is a useful project for students interested in business analytics and data science. Businesses collect sales information every day, and analyzing this information helps them understand customer behavior, product performance, and revenue growth.
The project uses sales datasets containing product names, prices, quantities sold, transaction dates, customer details, and locations.
Technologies used:
- R Programming
- ggplot2
- dplyr
- forecast
- readr
Key features:
- Calculate total sales and revenue.
- Identify best-selling products.
- Compare monthly and yearly sales.
- Analyze regional sales performance.
- Forecast future sales using historical data.
Students can use time-series analysis to predict future sales trends. The project demonstrates how R can support business decision-making and financial planning.
3. Weather Data Analysis and Prediction
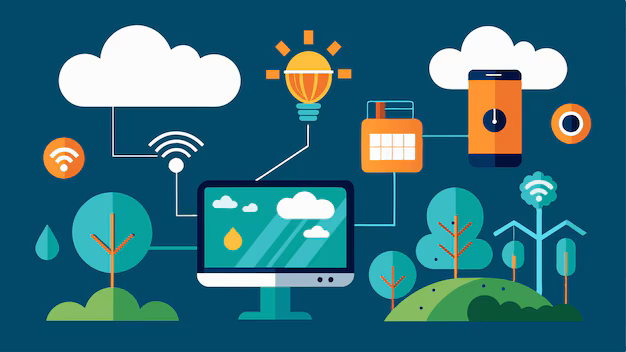
Weather Data Analysis is an interesting project that focuses on analyzing temperature, humidity, rainfall, wind speed, and atmospheric conditions.
Students can collect historical weather information from publicly available datasets and use R to identify weather patterns and seasonal changes.
Technologies used:
- R Programming
- tidyverse
- ggplot2
- lubridate
- Machine Learning libraries
Key features:
- Analyze daily and monthly temperatures.
- Identify rainfall patterns.
- Compare weather conditions across different locations.
- Visualize humidity and wind speed.
- Build a basic model to predict temperature.
This project introduces students to time-series data, data visualization, regression techniques, and exploratory data analysis. It can also be extended into a machine learning project for predicting weather conditions.
4. Customer Segmentation Using R
Customer Segmentation is a data science project that groups customers based on their purchasing behavior, spending habits, age, income, and preferences. Businesses use customer segmentation to develop targeted marketing strategies and improve customer satisfaction.
In this project, students use the K-Means clustering algorithm to divide customers into different groups based on similarities in their data.
Technologies used:
- R Programming
- ggplot2
- dplyr
- Cluster
- factoextra
Key features:
- Analyze customer purchasing patterns.
- Group customers based on spending behavior.
- Identify high-value customers.
- Visualize customer clusters.
- Support targeted marketing campaigns.
Students can use scatter plots and cluster visualizations to understand the characteristics of different customer groups. This project provides practical experience with unsupervised machine learning.
5. Healthcare Data Analysis

Healthcare Data Analysis is a valuable R project that focuses on analyzing medical datasets to identify patterns in patient information, diseases, health conditions, and treatment outcomes.
The dataset may contain patient age, medical history, blood pressure, glucose levels, cholesterol, and other health-related information. Students can analyze these records to understand health trends.
Technologies used:
- R Programming
- ggplot2
- dplyr
- Shiny
- Statistical analysis packages
Key features:
- Analyze patient demographic information.
- Visualize disease distribution.
- Compare health indicators.
- Identify statistical relationships between variables.
- Create an interactive healthcare dashboard.
This project helps students understand statistical analysis and data visualization in healthcare. The results should be treated as educational analysis rather than medical diagnosis or treatment recommendations.
6. Movie Recommendation System
A Movie Recommendation System is an interesting project for students who want to explore data science and recommendation algorithms. The system recommends movies to users based on their ratings, interests, genres, and viewing preferences.
Students can use movie datasets containing movie titles, genres, ratings, and user reviews.
Technologies used:
- R Programming
- recommenderlab
- dplyr
- ggplot2
- Shiny
Key features:
- Analyze movie ratings.
- Identify popular movies.
- Recommend movies based on similar preferences.
- Group movies by genre.
- Display personalized movie suggestions.
Students can implement collaborative filtering to recommend movies based on the preferences of users with similar interests. This project demonstrates how recommendation systems work in popular streaming platforms.
7. Social Media Sentiment Analysis

Social Media Sentiment Analysis is a project that analyzes text data to understand people’s opinions, emotions, and reactions toward products, brands, events, or services.
Students can use sample reviews, publicly available datasets, or appropriately collected text data. R helps process the text and classify opinions into positive, negative, and neutral categories.
Technologies used:
- R Programming
- tidytext
- tm
- ggplot2
- wordcloud
Key features:
- Clean and preprocess text data.
- Remove unnecessary words and punctuation.
- Identify frequently used words.
- Classify text into sentiment categories.
- Generate sentiment charts and word clouds.
This project introduces natural language processing, text mining, and visualization techniques. It can be used to study customer feedback and online discussions.
8. Personal Expense Analysis Dashboard
Personal Expense Analysis is a practical project that helps users understand their spending habits and manage their monthly budget. It analyzes expenses across categories such as food, transportation, rent, shopping, education, entertainment, and savings.
Students can create a sample expense dataset or use their own anonymized data to explore financial patterns.
Technologies used:
- R Programming
- Shiny
- ggplot2
- dplyr
- readr
Key features:
- Record income and expenses.
- Categorize spending.
- Calculate monthly savings.
- Compare expenses across months.
- Display interactive charts and dashboards.
Students can build an interactive dashboard using Shiny, allowing users to select a date range, expense category, and monthly budget. This project demonstrates how R can be used to develop interactive data applications.
How to Start an R Project
Students who want to develop any of these projects can follow a simple development process:
- Choose a project topic: Select a problem that can be solved using data analysis or statistical techniques.
- Collect a dataset: Download a dataset from Kaggle, government portals, or other publicly available data sources.
- Clean the data: Remove missing values, duplicates, incorrect entries, and unnecessary columns.
- Perform data analysis: Use R functions to calculate statistics, identify trends, and explore relationships.
- Create visualizations: Build graphs, charts, and dashboards using ggplot2 or Shiny.
- Test the project: Verify the results and ensure the visualizations accurately represent the dataset.
- Document the project: Prepare a project report containing objectives, methodology, results, screenshots, and conclusions.
Conclusion
R programming projects help students gain practical experience in data analysis, statistics, visualization, and machine learning. Projects such as student performance analysis, sales forecasting, customer segmentation, healthcare analysis, and sentiment analysis provide opportunities to solve real-world problems using programming.
Beginners can start with simple data analysis projects and gradually move toward machine learning and interactive dashboards. Completing these projects and adding them to a portfolio can help students demonstrate their technical skills during internships, academic presentations, and job interviews.
Learning R through practical projects is an effective way to build confidence, improve analytical thinking, and prepare for careers in data analytics, data science, statistics, and business intelligence.
Want to Learn More About Python & Artificial Intelligence ???, Kaashiv Infotech Offers Full Stack Python Course, Artificial Intelligence Course, Data Science Course & More Visit Their Website course.kaashivinfotech.com.