What Is GDB? Complete 2025 Guide to the GNU Debugger, Features, Commands & Career Impact

Ever spent hours staring at your C or C++ code, wondering why it’s crashing without mercy? You fix one bug, another shows up. That’s where GDB comes in — the GNU Debugger that’s been every system programmer’s secret weapon for decades.
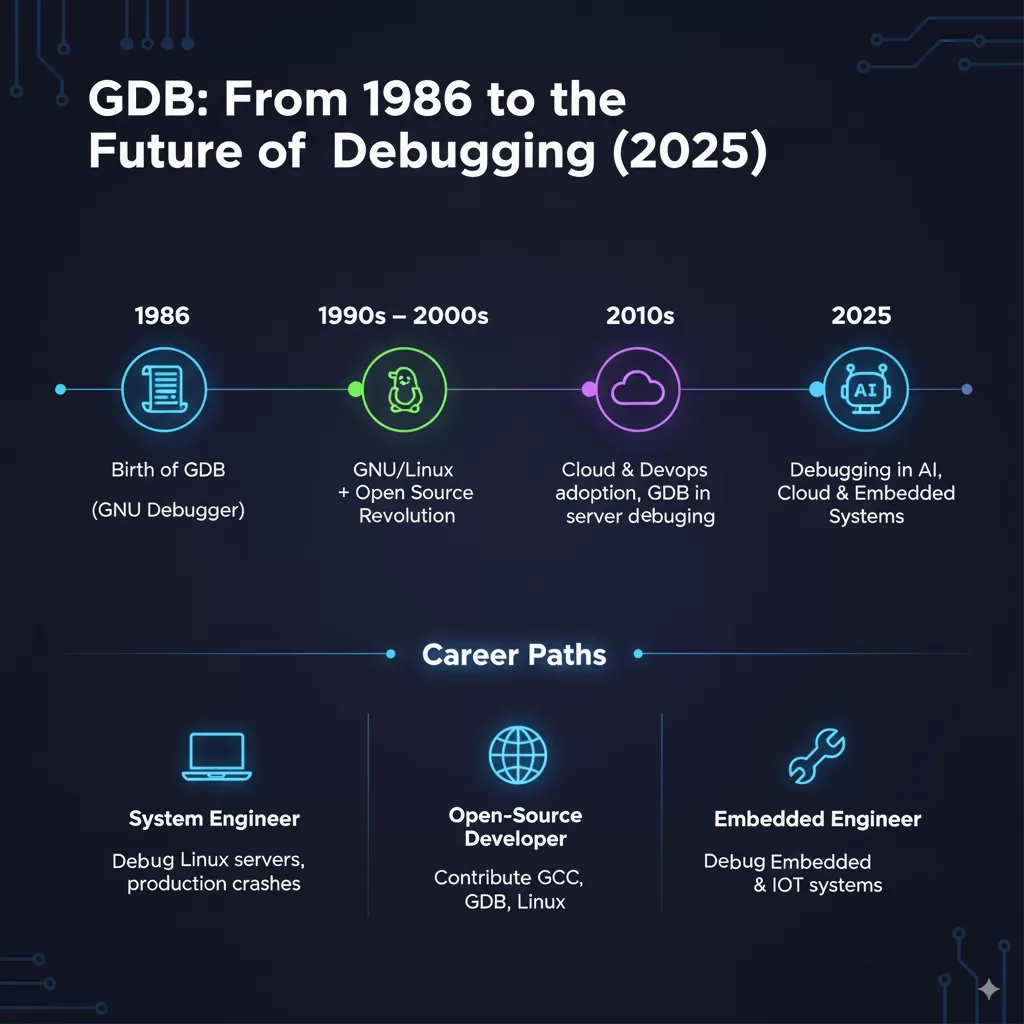
But wait — before you dismiss it as “old-school,” here’s a fact: over 70% of embedded systems companies still rely on GDB for debugging. In India, interviews for system engineer and embedded roles often include GDB exercises. Globally, giants like Red Hat, Intel, and Siemens still use it to debug kernels, compilers, and IoT devices.
⚡ Here’s the career hook: knowing GDB can make you stand out in cloud, DevOps, embedded, and data engineering roles. Skip it, and you risk falling behind developers who can deep-dive into the very guts of code execution.
So, let’s not just talk about GDB. Let’s actually use it — step by step.
👉 If you’re new to the GNU ecosystem, check out my GNU Full Form article before diving into GDB.
🔑 Key Highlights
- What is GDB? The GNU Debugger explained simply.
- Why use GDB in 2025? Still relevant in the age of IDEs.
- How to set it up and start debugging C/C++ code.
- Step-by-step guide with commands you’ll actually use.
- Real-world use cases: where GDB shines (kernel dev, IoT, servers).
- Career insights: jobs, salaries, and companies that still expect GDB skills.
🐧 What is GDB? (And Why It Still Matters in 2025)
GDB stands for GNU Project Debugger. It lets you:
- Peek inside your C/C++ programs while they run.
- Watch what happens when they crash.
- Control execution line by line.
- Inspect variables, memory, threads, and even change values mid-run.
Now you might ask: why not just use an IDE debugger like Visual Studio Code or CLion?
Here’s the catch — IDEs often wrap around GDB itself. Under the hood, GDB is still the engine doing the work.
In other words, if you know GDB, you can debug anywhere — from IoT devices to Linux servers — even when GUIs fail you.
⚙️ Setting Up GDB
For this demo, let’s assume you’re on a Linux machine. To check your system:
uname -a
Now, start GDB by typing:
gdb
If you see the gdb prompt, you’re in. To exit anytime:
quit
📝 Step 1: Compile Code with Debugging Info
Here’s a sample C program (test.c) that shows undefined behavior:
#include <stdio.h>
int main() {
    int x;
    int c = x + 1;
    printf("%d\n", c);
    return 0;
}
👉 Notice how x is uninitialized? This leads to garbage values.
Now compile it with debugging flags:
gcc -std=c99 -g -o test test.c
-g→ adds debugging info.-std=c99→ use C99 standard.-o test→ output file name.
🖥️ Step 2: Run GDB with Executable
gdb ./test
This loads your program into GDB.
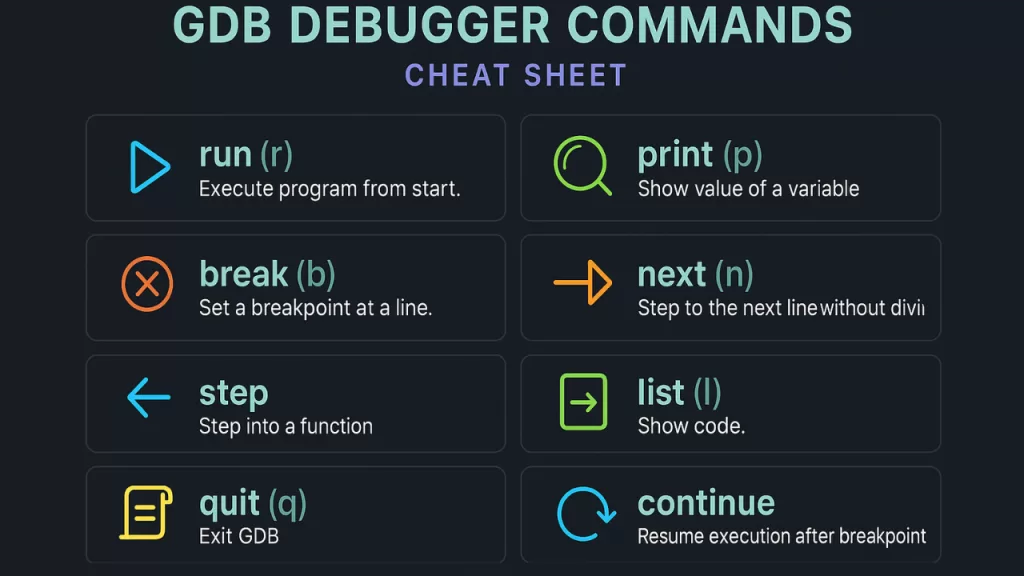
🛠️ Step 3: Essential GDB Commands
Here are the commands you’ll use daily:
| Command | What it does |
|---|---|
run or r | Executes the program |
break or b | Sets a breakpoint at a line |
disable | Turns off a breakpoint |
enable | Re-enables it |
next or n | Runs next line (skips functions) |
step | Steps into functions |
list or l | Shows code |
print or p var | Prints variable value |
set var=val | Changes variable value |
continue | Resumes execution |
quit or q | Exits GDB |
🧩 Step 4: Practical Debugging Walkthrough
Display Code
list
Shows your source code inside GDB.
Set a Breakpoint
break 5
Breaks at line 5. Use info b to view breakpoints.
Disable / Enable Breakpoints
disable 1
enable 1
Handy when toggling multiple breakpoints.
Run the Code
run
If no breakpoints exist, program runs fully.
Print & Change Variable Values
print x
set x=0
You can alter variables mid-run — powerful for testing.
🌍 Real-World Examples
- Linux Kernel Development → GDB is used to debug kernel modules.
- Embedded Systems (IoT, Automotive) → Microcontrollers often only support GDB for low-level debugging.
- DevOps & Cloud → Debugging crashes in Docker containers or servers where GUIs aren’t available.
- Academia & Colleges (India) → Students still use GDB in OS and compiler labs.
👉 Fun fact: The GNU 8085 Simulator widely used in Indian colleges often pairs with GDB for teaching microprocessor debugging.

💼 Careers & Salaries (2025 Insight)
Why should you still care about GDB? Because recruiters do.
- Job Roles: Linux system engineer, embedded developer, kernel programmer, DevOps engineer.
- India Salaries: ₹6–12 LPA for system engineers with GDB/Linux skills.
- Global Salaries: $85k–$120k for embedded/Linux kernel developers in the US.
Hiring trends:
- Over 35% of embedded job postings in 2025 explicitly list GDB experience.
- Companies like NVIDIA, Qualcomm, Intel, and Bosch still expect debugging skills at the GDB level.
⚡ Interview tip: Many Linux/embedded interviews ask you to use GDB live to debug a sample crash.
✅ Best Practices for Using GDB
- Always compile with
-gfor debugging symbols. - Use breakpoints sparingly; too many make debugging chaotic.
- Pair GDB with Valgrind for memory leak detection.
- Try TUI Mode (
gdb -tui) → splits screen to show source + debugging at once. - Learn scripting with Python in GDB for repetitive debugging tasks.
❓ FAQs
Q. Can GDB debug C++?
Yes, it works with both C and C++.
Q. Is GDB still relevant in 2025 with IDEs?
Absolutely. Many IDEs (VSCode, Eclipse) run GDB under the hood. For embedded/Linux debugging, GDB is irreplaceable.
Q. What’s the difference between GDB and LLDB?
LLDB is the LLVM project’s debugger (used in macOS/iOS). GDB dominates Linux/embedded systems.
🎯 Conclusion
In 2025, debugging is still one of the most time-consuming tasks in software development. GDB might look old-school, but it remains a must-know tool for developers working close to the system.
Think of it this way: IDE debuggers give you the surface. GDB gives you x-ray vision into your code. And in a world where performance, embedded systems, and cloud infrastructure still rule, that skill pays off.
So the next time your code throws garbage values, don’t panic — fire up GDB and let it guide you line by line.