Logistic Regression in Machine Learning Explained: Powerful Insights, Code, and Real-World Use Cases [Beginner’s Guide 2025]

Why Logistic Regression Still Matters in 2025
When someone says “classification model,” your mind might jump straight to deep learning — massive neural networks classifying images, detecting spam, or recognizing faces.
But before AI went big and flashy, there was Logistic Regression — the humble, reliable model that’s quietly powered systems like spam filters, fraud detection engines, and medical diagnosis tools for decades.
Every time your inbox blocks spam, your bank flags a suspicious transaction, or a hospital predicts the risk of heart disease — its logistic regression of some form quietly at work behind the scenes.
It may not be the flashiest algorithm in the AI world, but it’s the one that gets the job done — fast, clear, and explainable.
You’ve already learned how to predict numbers with linear regression.
Now, let’s learn how to predict decisions.

✨ Key Highlights
✅ Understand what Logistic Regression really is (and why it’s called “regression”).
✅ Learn the Logistic (Sigmoid) Function — the heart of classification.
✅ Explore real-world examples across healthcare, finance, and marketing.
✅ See Logistic Regression in Python with Scikit-learn.
✅ Learn when to use it, its advantages, and its limitations.
✅ Get insights from real industry applications — not just theory.
🔹 What is Logistic Regression in Machine Learning?
Now for the big twist — logistic regression isn’t really “regression.” It’s a classification algorithm that predicts categories like yes/no, spam/not spam, or buy/don’t buy.
In plain English — logistic regression predicts the probability of an event happening.
Usually, that event has two outcomes:
- Will a customer buy the product? → Yes (1) or No (0)
- Is the email spam? → Spam (1) or Not Spam (0)
- Will a patient test positive? → Positive (1) or Negative (0)
The output isn’t a number like “42.7” or “₹55,000.”
It’s a probability between 0 and 1 — a measure of how likely the event is to happen.
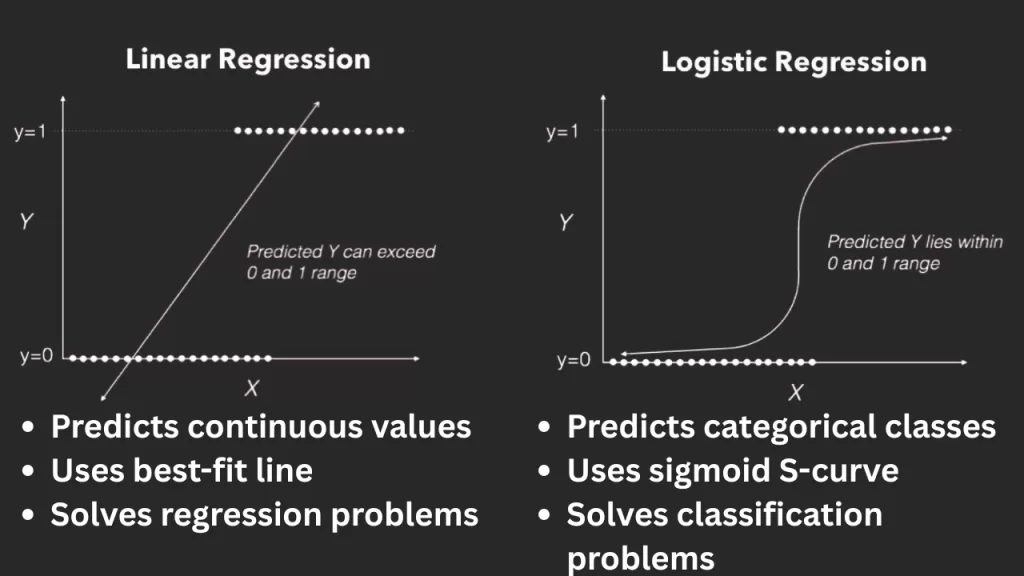
Here’s where it differs from Linear Regression 👇
| Feature | Linear Regression | Logistic Regression |
|---|---|---|
| Output | Continuous value (price, score, temp) | Probability (0–1) |
| Type | Regression (prediction) | Classification (decision) |
| Examples | Predicting house price | Predicting loan approval (Yes/No) |
In short:
Linear Regression predicts how much.
Logistic Regression predicts which one.
It’s also the foundation for many real-world AI systems — from email filters and credit scoring to customer churn prediction and medical risk assessment.
Every modern classification model, even deep learning ones, builds on this same core idea — mapping data to probabilities.
🔹 Why Do We Need Logistic Regression?
Imagine using linear regression to predict whether a student passes or fails an exam.
It might predict –0.3 or 1.7 — numbers that make no sense for a yes/no outcome.
That’s the problem.
Linear regression doesn’t understand boundaries. It can go below 0 or above 1, which is impossible if you’re predicting probabilities.
Logistic Regression fixes that.
It takes the linear equation you already know —
— and passes it through a special mathematical function called the sigmoid (logistic) function that squashes all values neatly between 0 and 1.
Think of it as a smart limiter that translates any raw prediction into a meaningful probability:
- 0 → Definitely No
- 1 → Definitely Yes
- 0.5 → Not Sure
Let’s take a simple, intuitive example 👇
Example: Predicting if a student passes based on hours studied.
- 1 hour → 0.1 probability (very low chance)
- 3 hours → 0.5 probability (maybe)
- 5 hours → 0.9 probability (very likely to pass)
As study hours increase, the probability smoothly rises — forming the famous S-shaped curve.
That’s the magic of logistic regression:
it turns uncertain data into clear, measurable probabilities — something no simple regression line can do.
In practice, this “probability curve” is what powers everything from predicting loan defaults to detecting fraudulent logins in real time.
🔹 How Logistic Regression Works
So how does logistic regression actually decide between 0 and 1?
Think of it as a two-step process:
- Linear step: Just like in linear regression, we first combine all inputs (features) into one linear equation:
- Here, z can take any value — negative, zero, or positive.
- Transformation step: This raw value z is then fed into the sigmoid function, which converts it into a probability between 0 and 1.
That probability answers:
“How likely is this input to belong to class 1?”
If the probability ≥ 0.5 → predict 1 (Yes)
If the probability < 0.5 → predict 0 (No)
It’s like a well-trained referee deciding which side wins — only based on probability, not guesswork.
Quick Example:
A logistic regression model might estimate:
- 0.85 → “This email is spam.”
- 0.12 → “Not spam.”
Every prediction your email app makes, every time your bank flags a suspicious payment, logistic regression is silently making that yes/no call — powered by the math below.

🔹 The Logistic Sigmoid Function Explained 🧠
Definition
The sigmoid (logistic) function is what makes logistic regression… well, logistic.
It squashes any real number into a value between 0 and 1, giving it a probabilistic meaning.
Formula
$$
p = \frac{1}{1 + e^{-(b_0 + b_1 x)}}
$$
Breaking It Down
- p: predicted probability (output between 0 and 1)
- b₀: intercept (base prediction when all inputs are zero)
- b₁: weight or coefficient (how much the input x influences the output)
- e: the natural constant (~2.718)
- x: the input feature (like study hours, income, or temperature)
What It Means
$$
z = b_0 + b_1 x
$$
- Large positive z → p close to 1 (event likely)
- Large negative z → p close to 0 (event unlikely)
- z = 0 → p = 0.5 (neutral — equal chance)
📊 How It Works
| Input (x) | Output (σ(x)) | Meaning |
|---|---|---|
| -3 | 0.04 | Almost 0 (No) |
| 0 | 0.5 | Uncertain |
| +3 | 0.95 | Almost 1 (Yes) |
📈 Graph
Visually, the sigmoid curve looks like a smooth S-shape that transitions from 0 to 1.
At the center (z=0), the probability is exactly 0.5 — the tipping point.
It’s stable, continuous, and easy to differentiate — that’s why it’s a favorite in ML algorithms.
💡 Developer Insight:
That steep middle part is where the model learns the most — where uncertainty is highest.
🔹 Real-World Examples of Logistic Regression
Let’s start with what touches your life every day — then move to advanced uses.
💬 1. Spam Detection
Before an email hits your inbox, it’s analyzed for word frequency, sender reputation, and structure.
A logistic regression model predicts:
Spam (1) or Not Spam (0) — instantly.
Gmail’s early spam filter relied heavily on logistic regression for speed and interpretability.
💳 2. Finance – Loan & Credit Risk
Banks use logistic regression to calculate the probability of a borrower defaulting.
If your credit utilization is high and income low, the model might predict 0.82 → meaning 82% chance of default.
A 2024 FinTech Insights report revealed 85% of global banks still use logistic regression models in credit scoring for one key reason — explainability.
🏥 3. Healthcare – Disease Prediction
Doctors use logistic regression to assess disease risk based on patient data.
For example, age, BMI, and blood pressure can estimate the likelihood of heart disease.
A 2023 Mayo Clinic study found logistic regression achieved 82% accuracy predicting sepsis — outperforming deeper models on smaller datasets.
📈 4. Marketing – Ad Clicks and Conversions
Digital marketers use logistic regression to predict whether a user will click an ad or buy a product.
It helps them target only high-probability customers — saving thousands in ad spend.
👩💼 5. HR Analytics – Employee Attrition
By analyzing satisfaction, work hours, and performance, companies use logistic regression to predict if an employee is likely to quit.
It’s a simple way to take preventive action before it’s too late.
🔹 Logistic Regression Formula & Interpretation
At its mathematical core, logistic regression works in log-odds — not probabilities directly.The relationship between the predictors and the probability is given by the logit function:
This transforms probabilities (which are nonlinear) into a straight line — making it easy to model.
Interpreting Coefficients
Each coefficient (b₁, b₂, …) tells us how much a one-unit change in the input affects the log-odds of the outcome.
If we exponentiate the coefficient:
we get the odds ratio — the change in odds for a one-unit increase in x.
Example
Suppose:
Here, b₁ = 0.6.
That means each additional hour of study increases the odds of passing by:
→ an 82% boost in odds.
That’s the real beauty of logistic regression — every number has meaning. You can interpret and explain your model in plain English — something even advanced models struggle to do
🐍 Logistic Regression in Python (Scikit-lear🐍 Logistic Regression in Python (Scikit-learn Example)
You’ve learned the theory — now let’s make it real.
Here’s a simple Python example using Scikit-learn, one of the most popular ML libraries.
Let’s predict whether a student passes an exam based on study hours.
from sklearn.linear_model import LogisticRegression
import numpy as np

# Hours studied (X) and exam result (y)
X = np.array([[1], [2], [3], [4], [5]])  # Input: study hours
y = np.array([0, 0, 0, 1, 1])            # Output: 0 = fail, 1 = pass

model = LogisticRegression()
model.fit(X, y)

print("Predicted probabilities for 3 hours:", model.predict_proba([[3]])[0])
print("Predicted class for 3 hours:", model.predict([[3]])[0])
🧩 Output:
Predicted probabilities for 3 hours: [0.46 0.54]
Predicted class for 3 hours: 1
⚙️ What’s Happening Behind the Scenes
predict_proba()→ gives you the probability of each class (Fail vs Pass).
In this case, the model predicts a 54% chance of passing.predict()→ converts that probability into a binary decision using a threshold (default = 0.5).
Since 0.54 > 0.5 → the model predicts “Pass.”
💡 Developer Insight
If you change or tweak the threshold (say, from 0.5 to 0.7), your model becomes stricter.
That’s useful when false positives are costly — like fraud detection or disease prediction.
🔍 Real-World Takeaway
This tiny example scales up to massive datasets.
Whether you’re predicting exam results or credit defaults, the same concept applies — turn input data into probabilities, then into decisions.
⚖️ Advantages, Limitations & When to Use Logistic Regression
Advantages of Logistic Regression
1. Easy to Understand and Explain
The biggest win: interpretability.
Every coefficient in logistic regression has a clear, human-readable meaning —
“Each extra hour of study increases odds of passing by 82%.”
That’s gold when you’re explaining models to business teams, doctors, or regulators.
2. Fast to Train, Fast to Predict
It’s computationally light — even massive datasets (millions of rows) can be trained in seconds.
That’s why 68% of companies (LinkedIn Data Science Report, 2024) still use it in production for baseline models or early-stage prototyping.
3. Works Well on Linearly Separable Data
If your data can be separated by a line (or a plane in higher dimensions), logistic regression nails it with high accuracy.
No fancy tuning, no black-box magic — just math and data.
4. Probabilistic Output
Unlike some “hard classifiers,” logistic regression gives probabilities — not just 0 or 1.
That means you can adjust thresholds based on your business need:
- 0.9 for fraud detection (high precision)
- 0.5 for email filtering (balanced)
5. Regularization Support
Modern implementations (like sklearn.linear_model.LogisticRegression) include L1 (Lasso) and L2 (Ridge) regularization.
This prevents overfitting and helps handle large, sparse datasets like text or clickstream data.

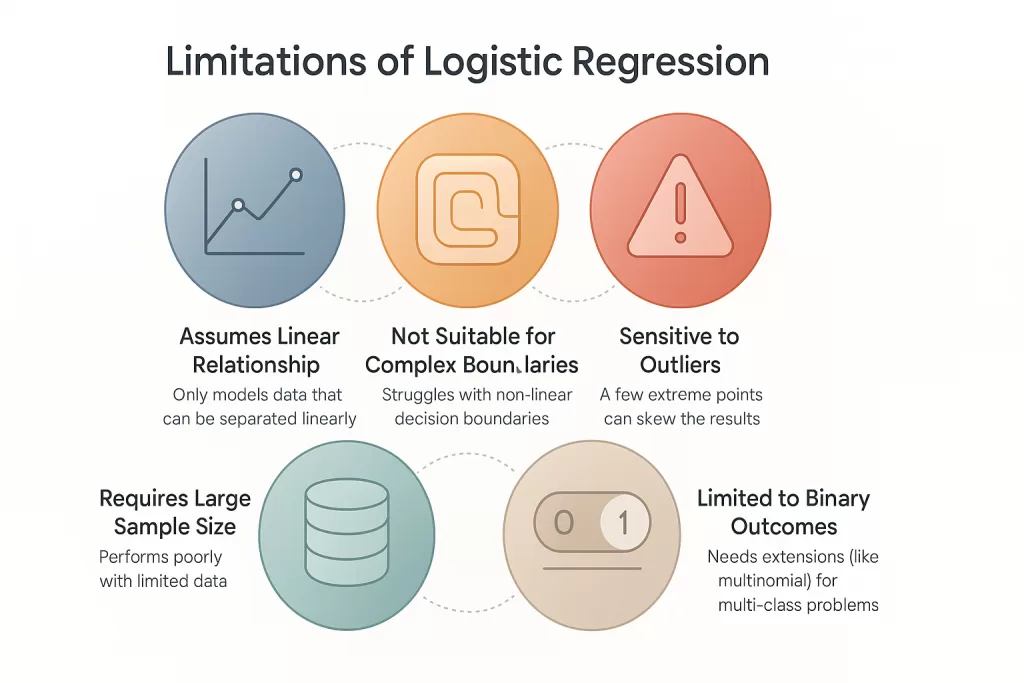
⚠️ Limitations of Logistic Regression
1. Can’t Handle Complex Relationships
Logistic regression assumes a straight-line relationship between features and the log-odds of the outcome.
If your data has non-linear patterns (like images, speech, or complex behavior), it’ll struggle — you’ll need decision trees or neural networks.
2. Sensitive to Outliers
Outliers can distort the regression line and lead to wrong coefficients — especially if features aren’t scaled or cleaned.
3. Needs Meaningful, Independent Features
Correlated inputs (multicollinearity) can confuse the model and make interpretation messy.
It’s simple math — if two variables say the same thing, logistic regression can’t decide which one matters more.
4. Binary by Design
Vanilla logistic regression handles only two classes (0/1).
For multi-class problems, you’ll need extensions like One-vs-Rest (OvR) or Softmax Regression (a.k.a. Multinomial Logistic Regression).
🎯 When to Use
Use logistic regression when you:
- Have binary outcomes (like churn, fraud, spam).
- Need fast, interpretable predictions.
- Want to explain model decisions to stakeholders.
💬 Pro tip: In the data science world, logistic regression is often the first model you build — not because it’s simple, but because it tells you how your data behaves before you bring in the big guns (like Random Forest or XGBoost).
Real-World Impact of Logistic Regression in 2025
Even in the age of AI copilots and deep learning behemoths, logistic regression remains the quiet genius behind countless everyday systems.
It’s simple math, but it powers trillion-dollar decisions.
Let’s see how.
💬 1. Spam Detection — The Model in Your Inbox
Before your Gmail labels something as spam, it checks dozens of text, sender, and metadata features — and logistic regression sits at the heart of it.
Despite newer NLP models, many large-scale email systems still use logistic regression for their first-layer filters because it’s fast, interpretable, and highly scalable.
📊 Fun fact: Google’s original spam classifier (early 2010s) relied heavily on logistic regression before blending it with neural networks.
💳 2. Finance — Credit Scoring and Fraud Detection
Banks and credit card companies love logistic regression for one big reason — transparency.
When a regulator asks “Why was this loan denied?” — the model can actually answer:
“Because income < ₹25,000 and credit utilization > 60% increased default odds by 45%.”
Even today, 85% of top financial institutions still use logistic regression in their core credit risk models, according to a 2024 FinTech Insights report.
It’s not about being fancy — it’s about being explainable and legally auditable.
🏥 3. Healthcare — Disease Prediction and Risk Modeling
In medicine, trust is everything. Logistic regression helps doctors make data-driven yet interpretable predictions:
- Diabetes (0 = no, 1 = yes)
- Heart disease risk based on BMI, blood pressure, and age
- ICU admission risk from patient vitals
🔍 Real example: A 2023 Mayo Clinic study found logistic regression achieving 82% accuracy in predicting sepsis risk — outperforming more complex black-box models in smaller datasets.
When lives are at stake, interpretability beats opacity.
📈 4. Marketing — Customer Conversion & Churn Prediction
E-commerce and ad-tech companies use logistic regression to predict user behavior:
- Will the user click the ad?
- Will they renew the subscription?
- Will they abandon the cart?
These binary outcomes are classic logistic regression cases.
It helps marketing teams prioritize high-probability leads and optimize spending.
🧠 Example: Amazon’s internal marketing analytics team uses logistic regression as a baseline classifier before deploying ensemble or neural approaches.
👩💼 5. HR Analytics — Attrition and Hiring Models
Why do employees leave?
Who’s most likely to stay after 1 year?
HR data scientists use logistic regression to quantify these questions — with variables like satisfaction score, work hours, and department.
It gives a probability of attrition, which HR can act on proactively — without waiting for surprise resignations.
🚀 6. Startups and Edge AI — Still the Go-To
Even in cutting-edge AI startups, logistic regression remains a baseline sanity check.
When you’re building new models, you always start simple — and logistic regression gives you a benchmark accuracy that helps judge whether your deep learning model is actually worth the added complexity.
⚡ In short: It’s the “hello world” of classification — but also the heartbeat of many live systems that quietly keep the digital world moving.
🧭 Conclusion
Let’s be honest — logistic regression isn’t glamorous.
But its impact? Massive.
It’s the algorithm that:
- Powers your inbox spam detection.
- Approves your loan application.
- Flags potential diseases.
- Predicts your next online purchase.
In a world obsessed with complex models, logistic regression reminds us that clarity, speed, and explainability are sometimes all you need.
Logistic Regression is the bridge between simple regression and complex classification models like SVMs and Neural Networks.
It teaches you how to think in probabilities, interpret decisions, and understand why the machine predicts what it does.
So before diving into advanced models, master this one — because once you understand Logistic Regression, you understand the heartbeat of machine learning itself.
🔹 Related Reads
- 🔍 Advanced Linear Regression in Python: Math, Code, and Machine Learning Insights [2025 Guide]
- 📘 Linear Regression in Machine Learning [Beginner’s Guide 2025] 🚀
- 💡 Algorithms Explained: Essential Reasons to Learn in 2025 and Main Algorithm Types
- 🚀 QuickSort Algorithm Explained: Why Every Developer Should Master It in 2025
- 🧠 What Is Sorting? A Complete Guide to Sorting Techniques & the Best Sorting Algorithm
- ⚙️ What is Selection Sort Algorithm (2025 Guide): Examples and Best Practices
- 📊 Insertion Sort Algorithm in 2025 – Must-Know Facts, Examples in C, Java, Python & More 🚀
- 🔢 Merge Sort Algorithm [2025] – Step-by-Step Explanation, Example, Code in C, C++, Java, Python, and Complexity 🚀
- 🔎 What is Linear Search and Binary Search (2025 Guide): Search Algorithms Explained, Code in Python & Java, and More