The IRIS Dataset in Depth: A Complete Beginner-to-Advanced Guide with Python & R Examples
The Iris Dataset is often the very first dataset introduced to anyone stepping into the world of Machine Learning. Despite its simplicity, it holds immense educational value and continues to be widely used for understanding classification, data visualization, and model evaluation techniques.
In this detailed guide, we’ll go beyond the basics—exploring the dataset’s structure, uncovering insights from its features, understanding classification deeply, and implementing practical examples using both Python and R.
🌸 Introduction to the IRIS Dataset
The Iris dataset was introduced by Ronald A. Fisher, one of the pioneers of modern statistics, in 1936. His goal was to demonstrate how statistical methods could be used to distinguish between different species of flowers based on measurable characteristics.
The dataset contains 150 samples of iris flowers, each belonging to one of three species: Setosa, Versicolor, and Virginica. What makes this dataset particularly interesting is that each flower is described using four measurable features, making it ideal for classification problems.
Unlike messy real-world datasets, this one is clean, balanced, and well-structured—making it perfect for both beginners and experienced practitioners who want to test algorithms quickly.
📊 Understanding the Structure of the Dataset
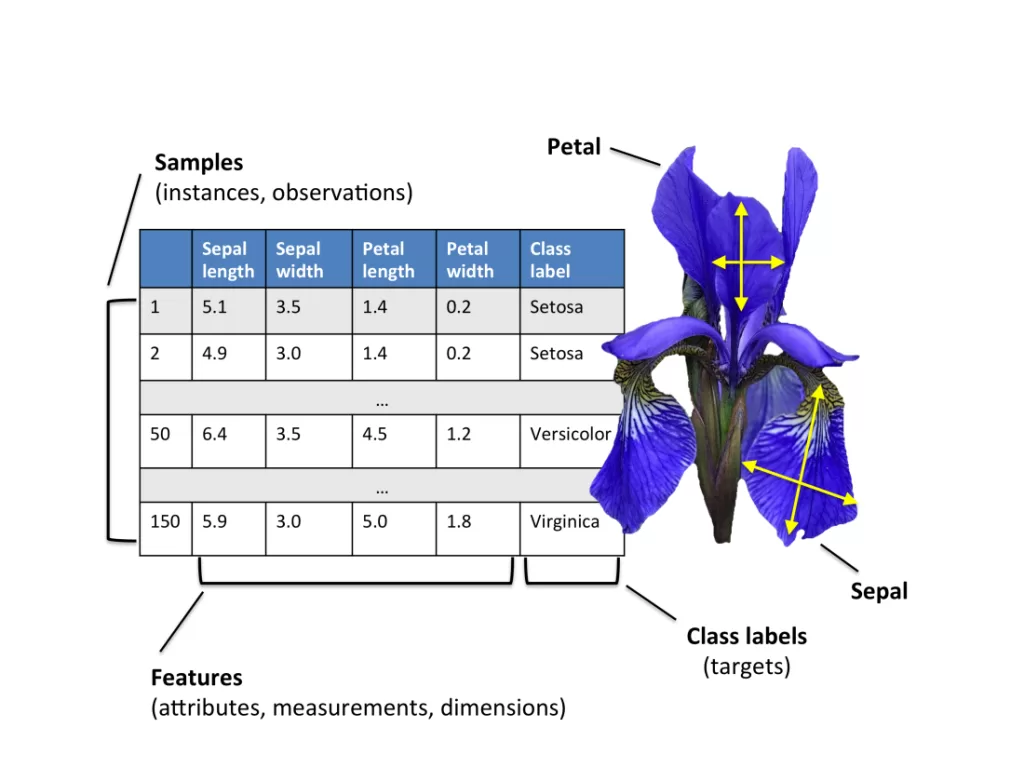
Each record in the dataset represents a single flower and contains four numerical inputs along with one categorical output.
The input features include sepal length, sepal width, petal length, and petal width—all measured in centimeters. These physical measurements are used to predict the species of the flower.
What makes the dataset especially useful is how these features relate to each other. For example, petal dimensions tend to vary significantly across species, making them strong predictors. On the other hand, sepal measurements show more overlap, which introduces slight complexity into the classification task.
This combination of separability and overlap creates a perfect learning environment for understanding how models make decisions.
🌼 A Deeper Look at the Three Classes
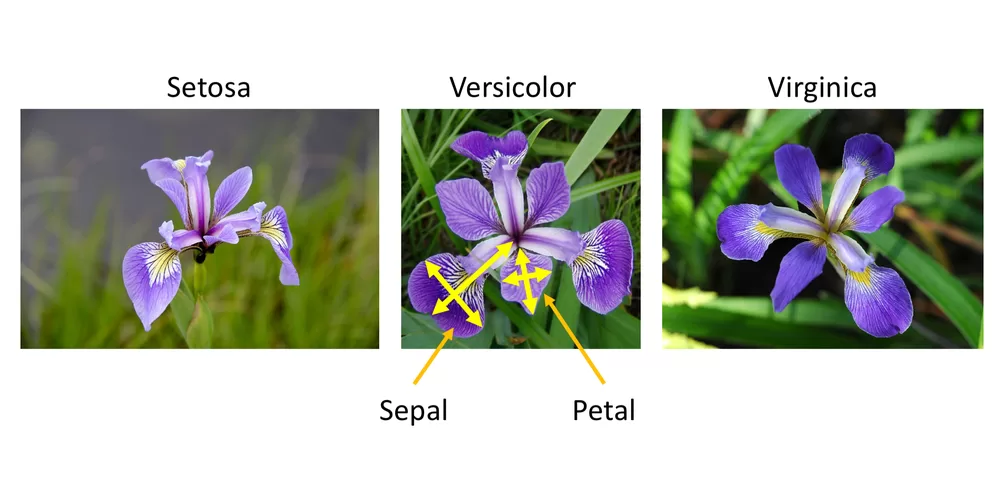
The three species in the dataset are not just labels—they exhibit distinct patterns when visualized.
Setosa is the easiest to classify because its petal length and width are significantly smaller compared to the other two species. Most algorithms can separate Setosa almost perfectly.
Versicolor and Virginica, however, share some similarities. Their petal and sepal measurements overlap to a certain extent, making classification slightly more challenging. This is where machine learning models truly demonstrate their capability to detect subtle patterns.
This natural separation and overlap help learners understand both the strengths and limitations of classification algorithms.
🔍 The Role of Classification in Machine Learning
At its core, this dataset is used to demonstrate Classification, a type of Supervised Learning where the model learns from labeled data.
In simple terms, a model is trained using input-output pairs, where the inputs are flower measurements and the outputs are species labels. Once trained, the model can predict the species of a new flower based on its measurements.
Different algorithms approach this task in different ways. Some rely on distance (like KNN), others create decision boundaries (like SVM), while some build tree-like structures (like decision trees). The Iris dataset provides a controlled environment to compare these approaches effectively.

🧠 Feature Importance and Insights
One of the most valuable lessons from working with the Iris dataset is understanding feature importance.
When analyzing the dataset, it becomes clear that petal length and petal width are far more informative than sepal measurements. These features create clearer boundaries between classes, especially for distinguishing Setosa from the other species.
This introduces an important concept in machine learning: not all features contribute equally. Identifying the most relevant features can significantly improve model performance and reduce complexity.
🐍 Implementing Classification in Python

Using Python, the Iris dataset can be easily accessed through the scikit-learn library, which provides built-in tools for machine learning.
The process typically begins with loading the dataset and separating it into input features and target labels. The data is then split into training and testing sets to evaluate the model’s performance on unseen data.
A commonly used algorithm for this dataset is K-Nearest Neighbors. This algorithm classifies a data point based on the majority class among its nearest neighbors.
Even with such a simple approach, the model often achieves very high accuracy, demonstrating how well-structured the dataset is.
📊 Visualizing Patterns in the Dataset
Visualization plays a crucial role in understanding how the data behaves. When plotted, the dataset reveals clear clusters, especially when using petal measurements.
Such visualizations help build intuition about how machine learning models separate data points in multi-dimensional space.
📘 Implementing the Same in R
R, a language widely used for statistical computing, also provides built-in access to the Iris dataset.
The workflow in R is quite similar—load the dataset, split it, train a model, and evaluate the results.
This consistency across languages highlights the universal nature of machine learning concepts.
🚀 Practical Learnings from the IRIS Dataset
Working with this dataset teaches more than just coding. It builds a strong conceptual foundation.
You begin to understand how models learn patterns, how data influences predictions, and why evaluation is important. You also gain insights into overfitting, feature selection, and model comparison—all of which are critical in real-world applications.
Although the dataset itself is simple, the principles it teaches are directly applicable to complex domains like healthcare, finance, and artificial intelligence systems.
⚖️ Strengths and Limitations

The Iris dataset is powerful because of its simplicity and clarity. It allows learners to focus on concepts without being overwhelmed by data cleaning or preprocessing.
However, this simplicity is also its limitation. Real-world datasets are often noisy, unbalanced, and much larger. They require additional steps such as data preprocessing, feature engineering, and hyperparameter tuning.
Understanding this gap is essential for transitioning from beginner to advanced levels in machine learning.
🎯 Final Thoughts
The Iris Dataset remains one of the most important learning tools in Data Science and machine learning. It offers the perfect balance between simplicity and insight, making it an ideal starting point for anyone entering the field.
By exploring it in depth and implementing models in both Python and R, you not only learn how algorithms work but also develop the intuition needed to tackle real-world problems.
Mastering this dataset is not just about understanding flowers—it’s about building the foundation for a successful journey in data science.
Want to Learn More About Python & Artificial Intelligence ???, Kaashiv Infotech Offers Full Stack Python Course, Artificial Intelligence Course, Data Science Course & More Visit Their Website course.kaashivinfotech.com.