🧠 Kohonen Self Organizing Map (SOM) Explained: A Complete Guide with Real-Life Examples 🧩
🤔 What is a Kohonen Self Organizing Map (SOM)? Let’s Demystify It
Let me be honest: when I first stumbled upon the term Kohonen self organizing map, I had a mini brain freeze. It sounded like something out of a futuristic science fiction novel. But once I dug in, I realized SOMs are super useful, surprisingly simple to understand, and still incredibly relevant in 2025 — especially for anyone learning machine learning with Python.
In simple terms, a Kohonen self organizing map (SOM) is a type of unsupervised neural network. It takes a large chunk of complicated, high-dimensional data and maps it onto a two-dimensional grid while keeping things that are similar close together.
This makes SOMs great for:
- Clustering
- Dimensionality reduction
- Data visualization
And guess what? You don’t need to be an AI expert to use them. All you need is curiosity, and maybe a good Python course under your belt.
💡 Why I Use SOMs (And You Might Want To)
We’re often told that machine learning needs a boatload of labeled data, massive GPUs, and complex models. But what if your data isn’t labeled? Or you just want to explore patterns?
That’s where SOM shines.
Here’s when I reach for a Kohonen map:
- When I need to visualize clusters in raw data
- When I want to group customers or behaviors without labels
- When I’m exploring machine learning datasets to understand patterns
I’ve used SOMs to segment e-commerce customers, to cluster similar job postings, and even to explore personality trait patterns from social media comments.
The magic? It’s all done in unsupervised learning, meaning the algorithm figures it out on its own — no labels, no supervision.
🧠 How Does a Kohonen Self Organizing Map Work?
Let’s get into the meat of it — but keep it digestible.
🧩 Step-by-Step Breakdown
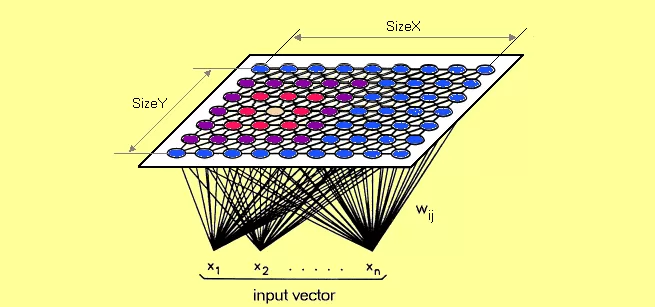
- Grid Creation: Start with a 2D grid of neurons, like a blank canvas.
- Feed Your Data: Every data point is compared to every neuron.
- Find the Winner (BMU): The Best Matching Unit is the closest neuron to your data point.
- Neighborhood Update: Not just the winner updates — its neighbors adjust too, mimicking biological neural behavior.
- Repeat: This goes on until the SOM learns your data’s structure.
This process mimics competitive learning, a subfield in neural networks, and has stood the test of time since the 1980s.
🧪 Self-Organizing Maps Tutorial in Python (Using MiniSom)
If you’re taking a Python course or exploring machine learning, you’ll love how practical this part is.
I used MiniSom, a lightweight and beginner-friendly library, to build my first SOM.
Here’s a simple working example:
from minisom import MiniSom
import numpy as np

# Generate dummy data
data = np.random.rand(200, 4)  # 200 samples, 4 features

# Initialize SOM
som = MiniSom(10, 10, 4, sigma=0.5, learning_rate=0.5)
som.train_random(data, 100)

# Visualize results
from pylab import bone, pcolor, colorbar, show
bone()
pcolor(som.distance_map().T)  # U-Matrix
colorbar()
show()
Pretty cool, right?
If you’re new to Python or want to explore this deeper, check out a hands-on Python course for machine learning — it’s where I picked up some solid basics to pull this off.
🧭 Real-Life Applications of Kohonen Maps

SOMs may sound old-school, but they’re used in modern, real-world scenarios. Here’s where I’ve seen them work:
- Customer Segmentation in marketing (e.g., grouping by behavior, not demographics)
- Voice Recognition & Spoken Document Indexing
- Financial Forecasting (detecting market anomalies)
- Climate Science – analyzing weather patterns using SOMs
- Cybersecurity – intrusion detection via cluster behavior
💡 How SOM Compares to Other ML Techniques
Let’s pit SOM against the big guns like PCA, t-SNE, and LSI:
| Technique | Unsupervised | Good for Clustering | Handles Non-linearities | Visual |
| PCA | ✅ | ❌ | ❌ | ✅ |
| t-SNE | ✅ | ✅ | ✅ | ✅ |
| SOM | ✅ | ✅ | ✅ | ✅ |
| LSI | ✅ | ❌ | ❌ | ⚠️ |
If you’re working through a machine learning course, you’ll see how SOM fits perfectly in exploratory data analysis workflows.
⚠️ What I Wish I Knew Earlier
Here’s me saving you hours of trial-and-error:
- Normalize your data – SOMs are sensitive to scale
- Start small – 10×10 grid is great for small datasets
- Use decaying learning rate – it helps SOM converge smoothly
- Visualize with a U-Matrix – it’s like a heatmap for cluster boundaries
Seriously, once I started plotting the U-Matrix properly, things clicked. That aha moment? Priceless. 🤯
🙌 Final Thoughts
Kohonen self organizing maps might not be the hottest AI trend of 2025, but their ability to visually cluster and interpret complex data makes them one of my go-to tools in my machine learning toolbox.
Whether you’re taking your first Python course, or knee-deep in a machine learning project, learning SOM opens up a new level of understanding.
So give it a shot. Play with some datasets. Cluster some tweets. Segment your Spotify songs. You might just find a pattern that surprises you. 😉
Got questions or want to share your SOM visualizations? Drop a comment or reach out — I’d love to geek out with you.