

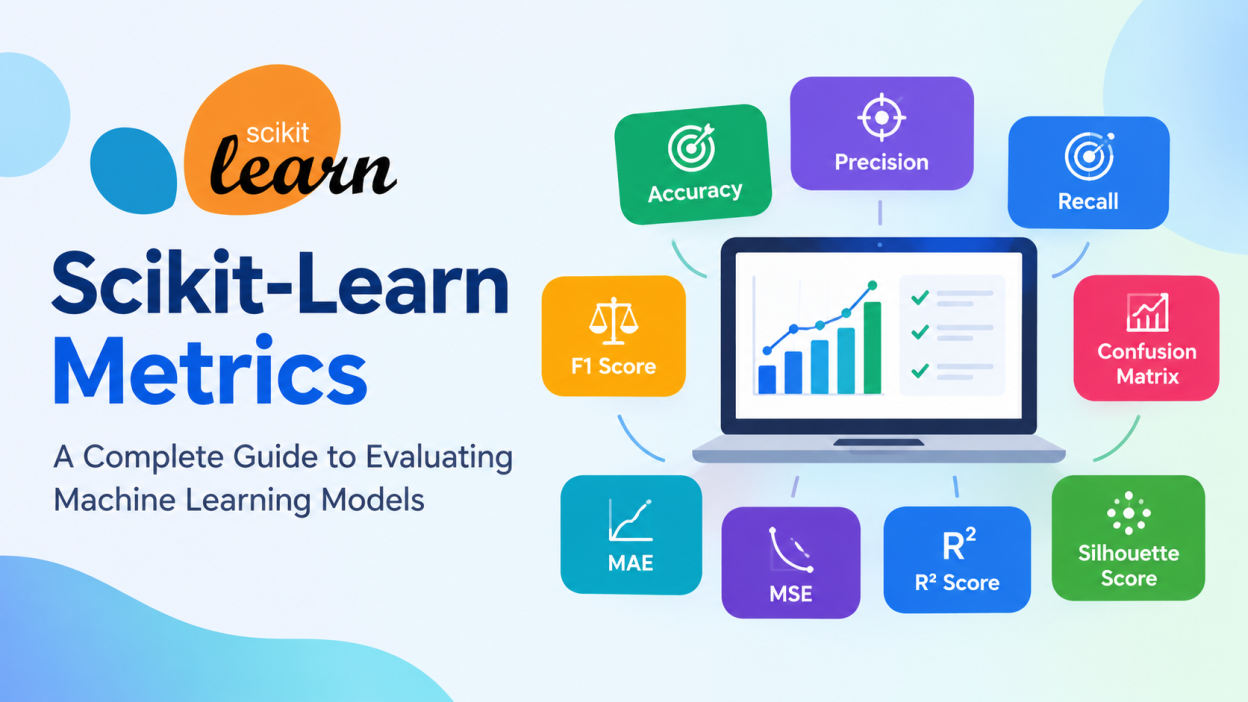
Machine learning is widely used to solve real-world problems such as predicting house prices, detecting spam emails, identifying fraudulent transactions, and recommending products. However, building a machine learning model is only one part of the process. It is equally important to understand how well the model performs. This is where Scikit-Learn metrics become useful.
Scikit-learn, also known as sklearn, is a popular Python library for building, training, and evaluating machine learning models. It provides several evaluation metrics that help developers measure prediction accuracy, identify errors, and compare different algorithms.
Choosing the right metric depends on the type of machine learning problem. Classification, regression, and clustering require different evaluation methods. In this article, we will explore the most important Scikit-Learn metrics, their applications, and how to use them in Python.
What Are Scikit-Learn Metrics?

Scikit-Learn metrics are evaluation functions used to measure the performance of machine learning models. They compare actual values with predicted values to determine how accurately a model solves a particular problem.
For example, consider a model that predicts whether an email is spam or legitimate. Accuracy can measure how many predictions are correct, while precision can show how many emails predicted as spam are actually spam.
These metrics help developers understand a model’s strengths and weaknesses. They are available through the sklearn.metrics module.
from sklearn.metrics import accuracy_score, precision_scoreDifferent metrics provide different perspectives on model performance. Therefore, selecting an appropriate metric is essential for building reliable machine learning applications.
Classification Metrics in Scikit-Learn
Classification is a machine learning task in which a model predicts categories, such as spam or not spam, positive or negative, and fraudulent or legitimate. Scikit-learn offers several metrics for evaluating classification models.
Accuracy Score
Accuracy measures the proportion of correct predictions among all predictions made by the model. It is one of the simplest evaluation metrics.
The formula is:
Accuracy = Correct Predictions / Total Predictions
For example, if a model correctly classifies 90 out of 100 customer transactions, its accuracy is 90%.
from sklearn.metrics import accuracy_scoreactual = [1, 0, 1, 1, 0]predicted = [1, 0, 1, 0, 0]print(accuracy_score(actual, predicted))Accuracy works well when classes are reasonably balanced. However, it can be misleading when one class appears much more frequently than another.
Precision Score
Precision measures how many positive predictions made by a model are actually positive.
For example, in spam detection, precision indicates how many emails classified as spam truly belong to that category. High precision helps reduce false positive predictions.
from sklearn.metrics import precision_scoreactual = [1, 0, 1, 1, 0]predicted = [1, 0, 1, 0, 0]print(precision_score(actual, predicted))Precision is particularly useful when false positive predictions are costly.
Recall Score
Recall measures how many actual positive cases the model successfully identifies.
For example, in disease screening or fraud detection, a high recall score can be important because missing a genuine positive case may have serious consequences.
from sklearn.metrics import recall_scoreactual = [1, 0, 1, 1, 0]predicted = [1, 0, 1, 0, 0]print(recall_score(actual, predicted))Precision and recall often involve a trade-off. Increasing one may reduce the other, depending on the model and its decision threshold.
F1 Score
The F1 score combines precision and recall into a single metric using their harmonic mean. It is useful when both false positives and false negatives matter.
from sklearn.metrics import f1_scoreactual = [1, 0, 1, 1, 0]predicted = [1, 0, 1, 0, 0]print(f1_score(actual, predicted))The F1 score ranges from 0 to 1, with higher values generally indicating a better balance between precision and recall. For multiclass problems, Scikit-Learn supports different averaging methods, including macro, micro, and weighted.
Regression Metrics in Scikit-Learn

Regression predicts continuous numerical values, such as salaries, temperatures, sales, or house prices. Regression metrics measure the difference between actual and predicted values.
Mean Absolute Error (MAE)
Mean Absolute Error calculates the average absolute difference between actual and predicted values. It is easy to understand because it uses the same units as the target variable.
from sklearn.metrics import mean_absolute_erroractual = [100, 200, 300, 400]predicted = [110, 190, 310, 380]print(mean_absolute_error(actual, predicted))A lower MAE indicates that predictions are closer to actual values on average.
Mean Squared Error (MSE)
Mean Squared Error calculates the average of the squared differences between actual and predicted values. Because errors are squared, larger errors receive greater penalties.
from sklearn.metrics import mean_squared_errorprint(mean_squared_error(actual, predicted))MSE is useful when large prediction errors should be penalized more heavily. However, its units are squared, which can make interpretation less intuitive.
R² Score
The R² score, also called the coefficient of determination, indicates how well a regression model explains the variation in the target variable relative to a baseline that predicts the target mean.
from sklearn.metrics import r2_scoreprint(r2_score(actual, predicted))An R² score of 1 represents perfect predictions. A score of 0 indicates performance equivalent to the mean-prediction baseline on the evaluated dataset, while a negative score means the model performs worse than that baseline.
Confusion Matrix
A confusion matrix summarizes classification predictions by comparing actual classes with predicted classes. For binary classification, it identifies four outcomes: true positives, true negatives, false positives, and false negatives.
Scikit-Learn provides the confusion_matrix() function to calculate these values.
from sklearn.metrics import confusion_matrixactual = [1, 0, 1, 1, 0]predicted = [1, 0, 1, 0, 0]print(confusion_matrix(actual, predicted))The confusion matrix helps developers understand which types of errors a model makes. It is especially useful in medical diagnosis, fraud detection, and security applications, where different mistakes may have different consequences.
ROC Curve and AUC Score
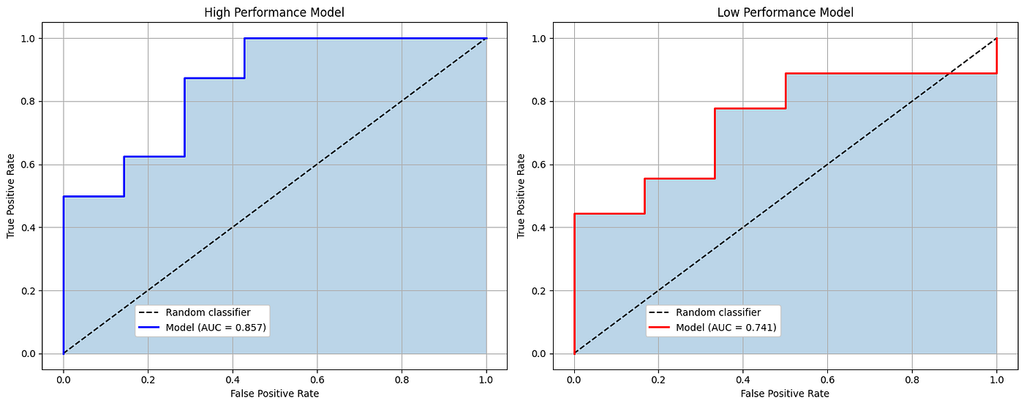
The Receiver Operating Characteristic (ROC) curve illustrates how the true positive rate changes against the false positive rate at different classification thresholds.
Scikit-Learn provides roc_curve() to calculate the values needed to plot the curve. The roc_auc_score() function calculates the Area Under the ROC Curve (AUC).
from sklearn.metrics import roc_auc_scoreactual = [0, 0, 1, 1]probabilities = [0.1, 0.4, 0.35, 0.8]print(roc_auc_score(actual, probabilities))AUC measures how well a model ranks positive examples above negative examples. A score closer to 1 generally indicates stronger discrimination, while a score around 0.5 suggests performance similar to random ranking.
Clustering Metrics

Clustering groups similar data points without requiring predefined class labels during training. Scikit-Learn provides metrics for evaluating the quality of these groups.
The Silhouette Score measures how similar each data point is to its own cluster compared with other clusters. Its values range from -1 to 1, and higher values generally indicate better-separated clusters.
from sklearn.metrics import silhouette_scorescore = silhouette_score(data, cluster_labels)print(score)Here, data represents the feature data and cluster_labels contains the cluster assignment for each sample.
Other clustering metrics include the adjusted Rand index and normalized mutual information, which can be used when reference labels are available.
How to Choose the Right Scikit-Learn Metric
Selecting the correct metric depends on your objective and the cost of different errors.
- Accuracy: Suitable when classes are balanced and mistakes have similar costs.
- Precision: Useful when false positives must be minimized.
- Recall: Important when missing positive cases is costly.
- F1 score: Helpful when balancing precision and recall.
- MAE: Suitable for interpreting average regression errors.
- MSE: Useful when large prediction errors need stronger penalties.
- R² score: Helps assess regression performance against a baseline.
- ROC-AUC: Useful for evaluating binary classifiers across decision thresholds.
- Silhouette score: Helps assess cluster separation when reference labels are unavailable.
Always evaluate models on data that was not used to train them. Otherwise, the results may give an overly optimistic view of performance. For reliable comparisons, use a suitable train-test split or cross-validation and consider class imbalance, data leakage, and the practical impact of prediction errors.
Conclusion
Scikit-Learn metrics are essential tools for evaluating machine learning models. They help developers measure prediction quality, compare algorithms, identify weaknesses, and make informed decisions about model improvements.
Classification metrics such as accuracy, precision, recall, and F1 score are useful for categorical predictions. Regression metrics such as MAE, MSE, and R² measure numerical prediction performance, while clustering metrics help assess how effectively data points are grouped.
There is no single metric that works best for every problem. By understanding the purpose and limitations of each evaluation method, developers can select the right metrics and build more reliable machine learning applications using Python and Scikit-Learn.
Want to Learn More About Python & Artificial Intelligence ?, Kaashiv Infotech Offers Full Stack Python Course, Artificial Intelligence Course, Data Science Course & More Visit Their Website course.kaashivinfotech.com.
Related Reads:
Artificial Intelligence vs Human Intelligence: A Deep Dive into Minds Made and Minds Born
Top 10 AI Tools for Content Creation in 2026 You Shouldn’t Miss.


