Jmeter Web Test Plan - jmeter - jmeter tutorial
learn apache jmeter tutorials - - elements - menu details - web testing Example
jmeter tutorials - jmeter load testing - jmeter download - download jmeter - apache jmeter
Start JMeter
- Open the JMeter window by clicking on/home/manisha/apache-jmeter-2.9/bin/jmeter.sh.
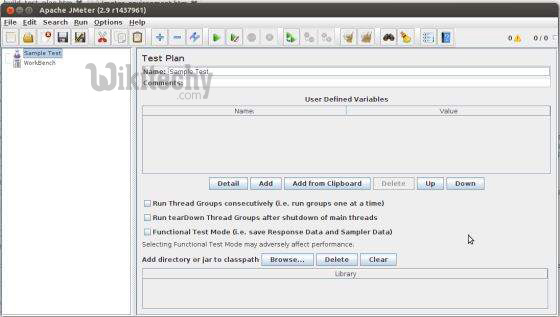
- The JMeter window appear as below

Rename the Test Plan
- Change the name of test plan node to Sample Test in the Name text box.
- You need to change the focus to workbench node and back to the Test Plan node to see the name getting reflected.
jmeter tutorials - jmeter load testing - jmeter download - download jmeter - apache jmeter
Add Thread Group
- Now we add our first element in the window. We add one Thread Group, which is a placeholder for all other elements like Samplers, Controllers, and Listeners. We need one so we can configure number of users to simulate. In JMeter, all the node elements are added by using the context menu.
- Right-click the element where you want to add a child element node.
- Choose the appropriate option to add.
- Right-click on the Sample Test (our Test Plan) > Add > Threads (Users) > Thread Group. Thus, the Thread Group gets added under the Test Plan (Sample Test) node.
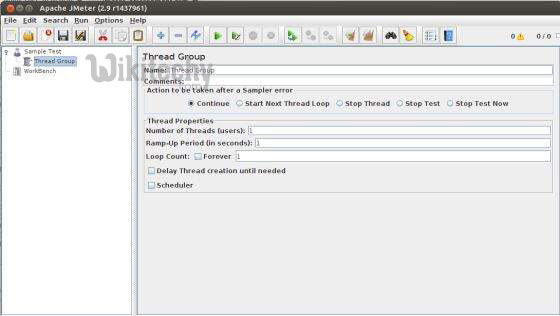
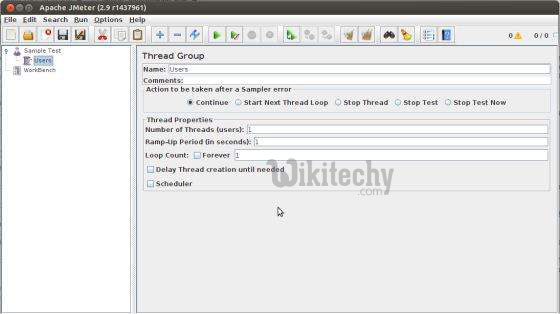
- Name the Thread Group as Users. For us, this element means users visiting the WikiTechy Home Page.
Add Sampler
- We need to add one Sampler in our Thread Group (Users).
- As done earlier for adding Thread group, this time we will open the context menu of the Thread Group (Users) node by right-clicking and we will add HTTP Request Sampler by choosing Add > Sampler > HTTP request option.
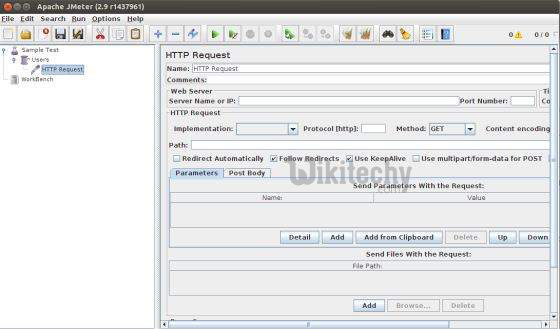
- It will add one empty HTTP Request Sampler under the Thread Group (Users) node. Let us configure this node element
- Name : We will change the name to reflect the action what we want to achieve. We will name it as Visit WikiTechy Home Page
- Server Name or IP : Here, we have to type the web server name. In our case it is www.Wikitechy.com. (http:// part is not written this is only the name of the server or its IP)
- Protocol : We will keep this blank, which means we want HTTP as the protocol.
- Path : We will type path as / (slash). It means we want the root page of the server.
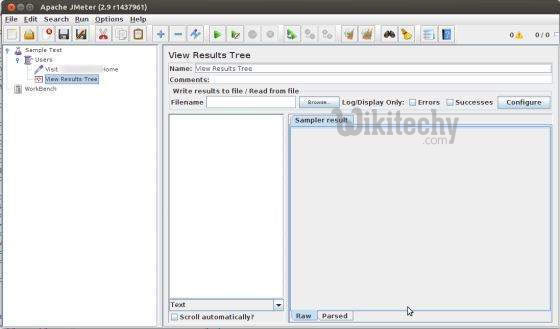
Add Listener
- We will now add a listener. Let us add View Results Tree Listener under the Thread Group (User) node. It will ensure that the results of the Sampler will be available to view in this Listener node element. To add a listener
- Open the context menu
- Right-click the Thread Group (Users)
- Choose Add > Listener > View Results Tree option
jmeter tutorials - jmeter load testing - jmeter download - download jmeter - apache jmeter
Run the Test Plan
- Now with all the setup, let us execute the test plan. With the configuration of the Thread Group (Users), we keep all the default values.
- It means JMeter will execute the sampler only once. It is similar to a single user, only once.
- This is similar to a user visiting a web page through browser, with JMeter sampler.
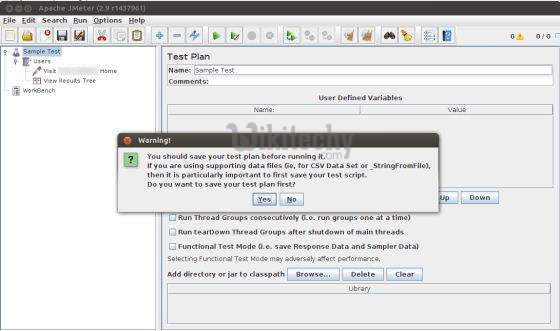
- To execute the test plan, Select Run from the menu and select Start option.
- Apache JMeter asks us to save the test plan in a disk file before actually starting the test.
- This is important if you want to run the test plan multiple times. You can opt for running it without saving too.
View the Output
- We have kept the setting of the thread group as single thread (one user only) and loop for 1 time (run only one time), hence we will get the result of one single transaction in the View Result Tree Listener.
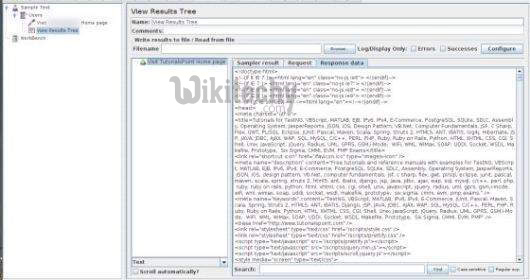
- Details of the above result are
- Green color against the name Visit Wikitechy Home Page indicates success.
- JMeter has stored all the headers and the responses sent by the web server and ready to show us the result in many ways.
- The first tab is Sampler Results. It shows JMeter data as well as data returned by the web server.
- The second tab is Request, which shows all the data sent to the web server as part of the request.
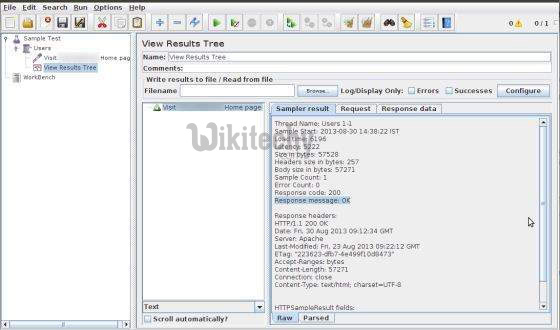
- The last tab is Response data. In this tab, the listener shows the data received from server in text format.
- This is just a simple test plan which executes only one request.
- But JMeter's real strength is in sending the same request, as if many users are sending it.
- To test the web servers with multiple users, we need to change the Thread Group (Users) settings.