
Data analysis is one of the most valuable skills in today’s technology-driven world. Businesses collect large amounts of data every day, but raw data alone cannot provide useful information. Data analysis helps organizations understand information, identify patterns, solve problems, and make better decisions.
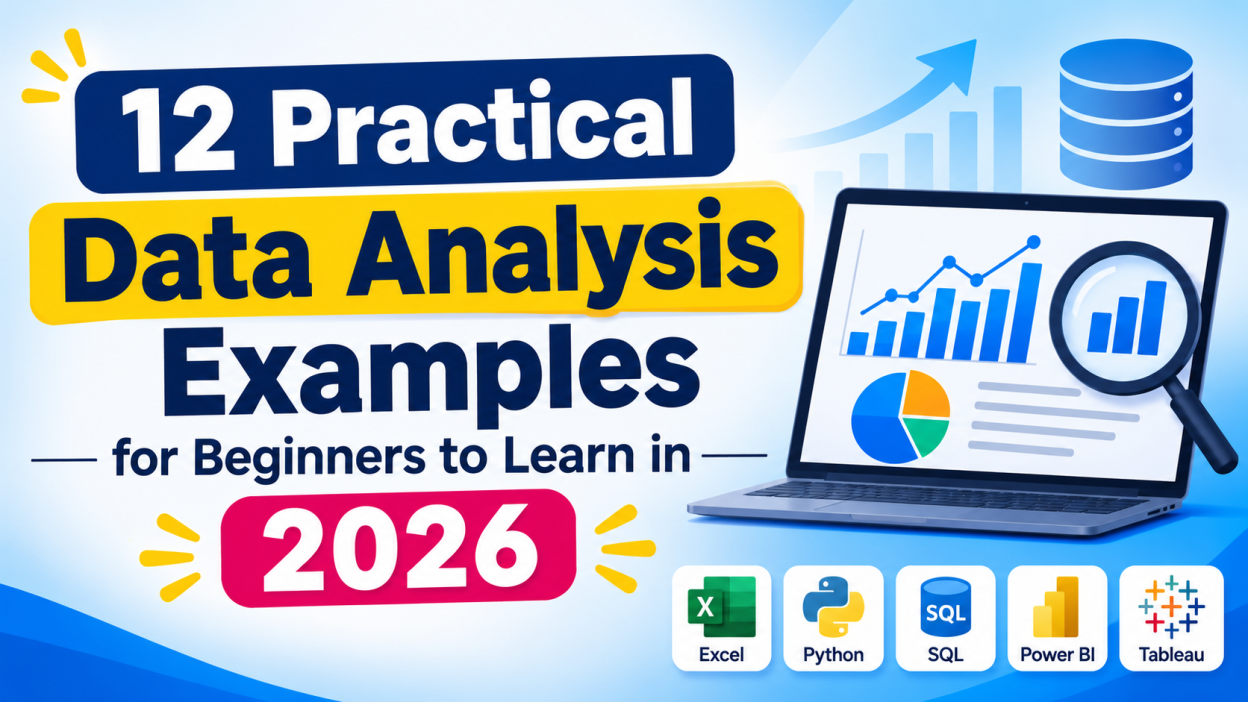
For beginners, learning data analysis through practical examples is one of the best ways to understand how it works. Instead of focusing only on theoretical concepts, beginners can work with real-world datasets and use tools such as Excel, Python, SQL, Power BI, and Tableau.
In 2026, data analysis skills are useful across industries such as healthcare, finance, education, retail, marketing, and information technology.
This article explores 12 practical data analysis examples that beginners can try to improve their analytical and technical skills.
What Is Data Analysis?
Data analysis is the process of collecting, cleaning, organizing, examining, and interpreting data to discover useful information. It helps individuals and businesses understand what is happening and make informed decisions.
For example, an online shopping company can analyze customer purchases to identify its most popular products. Similarly, a hospital can analyze patient records to understand treatment patterns.
The main steps involved in data analysis include:
- Data Collection: Gathering information from different sources.
- Data Cleaning: Removing duplicate, incorrect, or missing values.
- Data Organization: Arranging information into a structured format.
- Data Analysis: Identifying patterns, relationships, and trends.
- Data Visualization: Presenting findings through charts and dashboards.
- Decision-Making: Using the results to solve problems.
12 Practical Data Analysis Examples for Beginners
Here are 12 beginner-friendly data analysis projects that help you understand how data is used in real-world situations.
1. Student Performance Analysis

Student performance analysis is a simple project for beginners to understand how educational institutions use data.
In this project, you can collect information about students, including their names, attendance percentages, subject marks, and examination results.
Analyze the dataset to identify students with high and low academic performance. You can also examine whether attendance has any relationship with examination results.
Tools to use: Microsoft Excel, Python, Pandas, and Power BI.
What you will learn: Data cleaning, average calculations, filtering, and visualization.
2. Sales Data Analysis
Sales data analysis helps businesses understand their sales performance and identify profitable products.
For this project, use a sample sales dataset containing product names, prices, quantities, order dates, and customer details.
Analyze monthly revenue, total sales, best-selling products, and regional performance. You can also compare sales across different months to identify seasonal trends.
Tools to use: Excel, SQL, Python, and Power BI.
What you will learn: Revenue calculations, grouping, trend analysis, and dashboard creation.
3. Customer Behaviour Analysis

Customer behaviour analysis helps businesses understand how customers interact with their products and services.
You can work with a dataset containing customer age, location, purchase history, shopping frequency, and spending amounts.
Identify which customer groups purchase more frequently and which products attract the most attention. This information helps businesses improve marketing strategies.
Tools to use: Python, Excel, SQL, and Tableau.
What you will learn: Customer segmentation, data filtering, and pattern identification.
4. Website Traffic Analysis
Website traffic analysis is useful for understanding how visitors interact with a website.
You can use sample website analytics data containing visitor counts, page views, traffic sources, session duration, and bounce rates.
Analyze which pages receive the highest traffic and identify where visitors come from. You can also compare organic search, social media, and direct traffic.
Tools to use: Google Analytics 4, Excel, and Power BI.
What you will learn: Traffic analysis, user behaviour tracking, and performance reporting.
5. Employee Attendance Analysis
Employee attendance analysis helps organizations monitor employee working patterns.
Create a dataset containing employee names, attendance dates, working hours, leave records, and late arrivals.
Calculate monthly attendance percentages and identify employees with frequent absences. You can also prepare reports to understand overall attendance patterns.
Tools to use: Excel, Python, and Power BI.

What you will learn: Date functions, conditional formatting, data filtering, and reporting.
6. Social Media Engagement Analysis
Social media engagement analysis helps businesses understand how their content performs across different platforms.
Collect sample data containing likes, comments, shares, followers, impressions, and post dates.
Compare engagement across different posts and identify which content receives the most interaction. You can also analyze the best-performing content formats.
Tools to use: Excel, Python, Pandas, and Tableau.
What you will learn: Engagement calculations, comparison analysis, and visualization.
7. Healthcare Data Analysis
Healthcare data analysis is useful for identifying patterns in patient information and hospital operations.
For this beginner project, use an anonymized or synthetic dataset containing patient age groups, appointment dates, department names, and waiting times.
Analyze the number of patients visiting each department and identify periods with higher appointment demand.
Tools to use: Python, Excel, SQL, and Power BI.
What you will learn: Data organization, statistical analysis, and trend identification.
Note: Always use synthetic or properly anonymized patient data for learning projects.
8. E-Commerce Product Analysis
E-commerce product analysis helps online businesses understand product performance and customer purchasing trends.
Use a sample dataset containing product categories, prices, ratings, stock quantities, and order details.
Identify popular product categories, compare customer ratings, and analyze which products generate the highest revenue.
Tools to use: Excel, SQL, Python, and Tableau.
What you will learn: Product comparison, aggregation, ranking, and data visualization.
9. Financial Expense Analysis
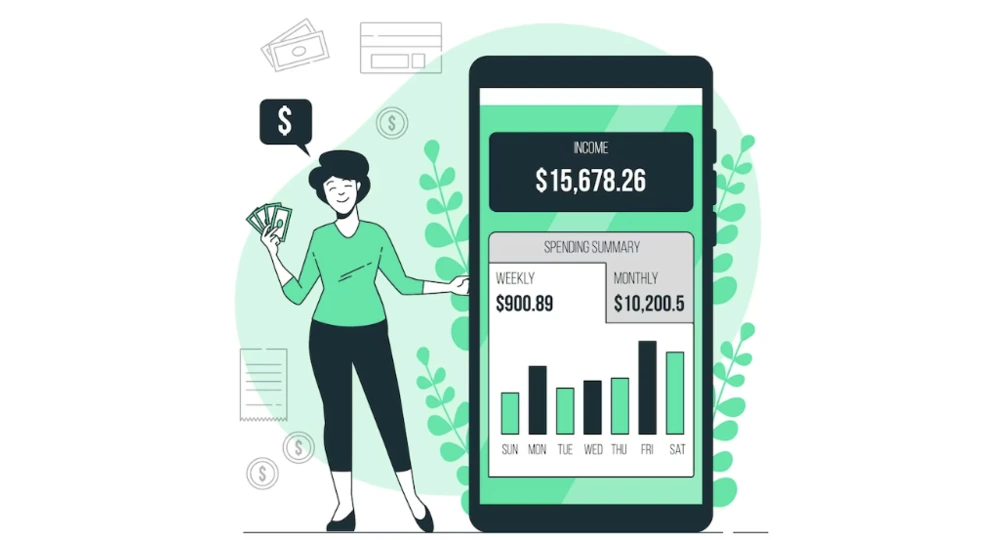
Financial expense analysis helps individuals and organizations understand how money is spent.
Create a sample dataset containing monthly income, expenses, savings, and spending categories such as food, transportation, rent, and entertainment.
Calculate total monthly expenses and identify categories where spending is highest. You can also compare monthly savings.
Tools to use: Microsoft Excel, Python, and Power BI.
What you will learn: Mathematical calculations, budgeting analysis, and financial reporting.
10. Weather Data Analysis
Weather data analysis helps beginners understand how environmental information can be studied using datasets.
Collect sample weather information containing temperature, humidity, rainfall, wind speed, and dates.
Analyze temperature changes over time and identify days with heavy rainfall. You can also compare weather conditions across different months.
Tools to use: Python, Pandas, Matplotlib, and Excel.
What you will learn: Time-series analysis, statistical calculations, and charts.
11. Movie Rating Analysis
Movie rating analysis is an interesting project for beginners who enjoy working with entertainment-related datasets.
Use a dataset containing movie titles, genres, release years, ratings, and review counts.
Identify the highest-rated movies, compare ratings across genres, and examine how movie ratings change over different release periods.
Tools to use: Python, Pandas, SQL, and Tableau.
What you will learn: Sorting, grouping, filtering, and comparative analysis.
12. Transportation Data Analysis

Transportation data analysis helps organizations understand travel patterns and improve transportation services.
For this project, use a sample dataset containing vehicle types, travel distances, journey times, passenger counts, and fuel consumption.
Analyze average journey times, identify busy travel periods, and compare fuel consumption across different vehicle categories.
Tools to use: Excel, Python, SQL, and Power BI.
What you will learn: Data aggregation, comparison, time-based analysis, and reporting.
Best Tools for Beginners to Learn Data Analysis in 2026
Choosing the right tools is important when starting a career in data analysis. Beginners should first understand spreadsheet operations and gradually move toward programming and visualization tools.
| Tool | Main Purpose |
|---|---|
| Microsoft Excel | Data cleaning and calculations |
| SQL | Retrieving and managing database information |
| Python | Data processing and analysis |
| Pandas | Working with structured datasets |
| Power BI | Creating interactive dashboards |
| Tableau | Data visualization and reporting |
| Google Analytics 4 | Website traffic analysis |
Learning Excel, SQL, Python, and Power BI can provide a strong foundation for practical data analysis projects.
How to Start Learning Data Analysis as a Beginner
If you are new to data analysis, follow a step-by-step learning approach.
- Learn Excel Basics: Understand formulas, sorting, filtering, PivotTables, and charts.
- Understand Statistics: Learn averages, percentages, median, standard deviation, and correlation.
- Practice SQL: Understand SELECT, WHERE, GROUP BY, ORDER BY, and JOIN operations.
- Learn Python: Practice variables, loops, functions, and libraries such as Pandas and Matplotlib.
- Explore Visualization Tools: Create interactive dashboards using Power BI or Tableau.
- Build Practical Projects: Complete projects using real-world or sample datasets and upload them to your portfolio.
Consistent practice will help you develop the confidence needed to work with different types of datasets.
Conclusion
Data analysis is a valuable skill for beginners who want to build a career in technology and business analytics. Working on practical projects such as student performance analysis, sales analysis, customer behaviour analysis, website traffic analysis, and financial expense analysis helps you understand how data supports real-world decisions.
Start with simple datasets and gradually explore advanced tools such as Python, SQL, Power BI, and Tableau. Building these 12 beginner-friendly projects will improve your technical knowledge, analytical thinking, and problem-solving abilities.
In 2026, developing practical data analysis skills and maintaining a strong project portfolio can help beginners prepare for opportunities in data analytics and related career fields.
Want to learn more ??, Kaashiv Infotech Offers Data Analytics Course, Data Science Course, Cyber Security Course & More Visit Their Website www.kaashivinfotech.com.