You built a model to predict house prices. It has two features: sq_ft (ranging from 500 to 5,000) and num_bedrooms (ranging from 1 to 5). Your model’s results are bizarre—it thinks sq_ft is 1,000x more important than num_bedrooms, even when it’s not.
Why? Because you haven’t scaled your features.
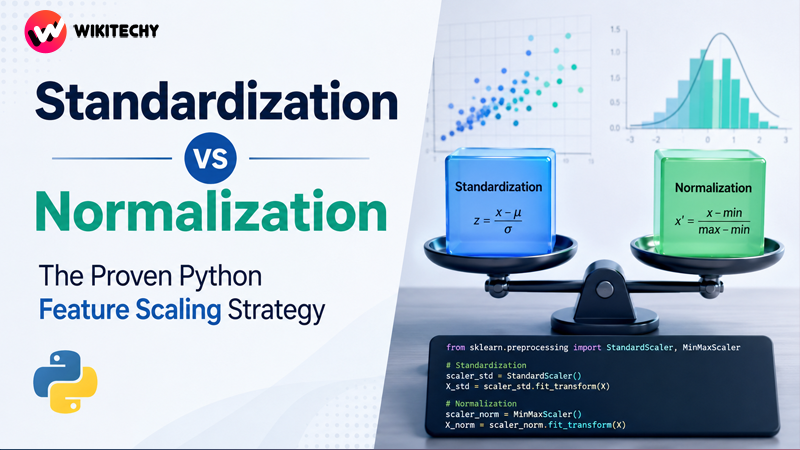
This is one of the most common beginner mistakes in data science. In the world of Standardization vs Normalization, choosing the right feature scaling technique is a simple step that can dramatically improve your model’s performance. Let’s fix this right now.
What is Feature Scaling and Why Does it Matter?
Feature scaling is a data preprocessing step that brings all numerical features onto a common scale, without distorting the differences in the ranges of values.
Think about it: many machine learning algorithms work by calculating distances between data points or using gradient descent. If one feature has a much larger scale (like salary in dollars) than another (like years_of_experience), the feature with the larger scale will dominate and unfairly influence the model.
Your model doesn’t know what “dollars” or “years” are; it just sees numbers. Scaling tells your model to treat all features equally at the start.
🧠 Which algorithms are sensitive to scale?
- Algorithms that use distance: K-Nearest Neighbors (KNN), K-Means Clustering, Support Vector Machines (SVM).
- Algorithms that use gradient descent: Linear Regression, Logistic Regression, Neural Networks.
- Other algorithms: Principal Component Analysis (PCA).
Which algorithms are NOT sensitive to scale? Tree-based models like Decision Trees, Random Forests, and Gradient Boosting are generally immune because they make decisions by splitting features at thresholds, regardless of their scale.
The Lab: Setting Up Our Dataset
Let’s create a simple dataset with Age and Salary to see the problem firsthand.
Pythonimport pandas as pd
import numpy as np
import matplotlib.pyplot as plt
import seaborn as sns
from sklearn.preprocessing import StandardScaler, MinMaxScaler

# Create a sample DataFrame
data = {
    'Age': [25, 32, 45, 28, 50, 62],
    'Salary': [50000, 75000, 120000, 60000, 150000, 95000]
}
df = pd.DataFrame(data)

print("Original Data:")
print(df)
Method 1: Standardization (Z-score Scaling)
Standardization rescales data to have a mean (μ) of 0 and a standard deviation (σ) of 1. The formula is (x - μ) / σ.
This is the most common scaling technique and is often the default choice.
Python Code with StandardScaler
Pythonscaler_std = StandardScaler()
df_std = pd.DataFrame(scaler_std.fit_transform(df), columns=df.columns)

print("\nStandardized Data:")
print(df_std)

print("\nNew Mean (approx 0):")
print(df_std.mean())

print("\nNew Std Dev (approx 1):")
print(df_std.std())
Visualization: Before and After Standardization
Pythonplt.figure(figsize=(12, 5))

plt.subplot(1, 2, 1)
sns.scatterplot(data=df, x='Age', y='Salary')
plt.title("Before Scaling")

plt.subplot(1, 2, 2)
sns.scatterplot(data=df_std, x='Age', y='Salary')
plt.title("After Standardization")

plt.show()
Notice how the second plot is centered around (0,0), but the shape of the data remains the same.
Method 2: Normalization (Min-Max Scaling)
Normalization rescales data to a fixed range, usually 0 to 1. The formula is (x - min) / (max - min).
Python Code with MinMaxScaler
Pythonscaler_norm = MinMaxScaler()
df_norm = pd.DataFrame(scaler_norm.fit_transform(df), columns=df.columns)

print("\nNormalized Data:")
print(df_norm)

print("\nNew Min (approx 0):")
print(df_norm.min())

print("\nNew Max (approx 1):")
print(df_norm.max())
Visualization: Before and After Normalization
Pythonplt.figure(figsize=(12, 5))

plt.subplot(1, 2, 1)
sns.scatterplot(data=df, x='Age', y='Salary')
plt.title("Before Scaling")

plt.subplot(1, 2, 2)
sns.scatterplot(data=df_norm, x='Age', y='Salary')
plt.title("After Normalization")

plt.show()
Here, you can see the data is squeezed into a neat 0-to-1 square.
The Ultimate Decision Guide: Standardization vs Normalization
This is the million-dollar question. Here’s a cheat sheet to help you decide.
| Situation | Recommended Scaler | Why? |
|---|---|---|
| I’m not sure / Default choice | Standardization | It’s robust, widely used, and works well for most algorithms. It’s less sensitive to outliers. |
| My data has outliers | Standardization | Min-Max Normalization’s range is heavily affected by outliers. Standardization is more robust. |
| My algorithm assumes a normal distribution | Standardization | It centers the data around 0, which aligns with the assumptions of algorithms like SVM and Linear Regression. |
| I need my values in a specific range | Normalization | Common in image processing (0-255 pixels scaled to 0-1) or some neural networks. |
| My data is not normally distributed | Normalization | It doesn’t make assumptions about the data’s distribution, so it can be a good choice for non-Gaussian data. |
The Golden Rule: When in doubt, start with Standardization. It’s the safer and more common default for data scaling in machine learning.
Common Mistakes and Pro-Tips (The Career Angle)
Knowing the code is one thing. Avoiding rookie mistakes is what gets you hired.
⚠️ Mistake #1: Data Leakage from the Test Set
This is the most critical mistake to avoid. You should NEVER fit your scaler on the test data. You must fit the scaler only on your training data and then use that same fitted scaler to transform both your training and test sets.
Wrong Way (Leakage!):
Python# FITTING ON THE WHOLE DATASET - BAD!
scaler.fit(X)
X_train_scaled = scaler.transform(X_train)
X_test_scaled = scaler.transform(X_test)
Right Way (No Leakage):
Python# 1. Fit ONLY on the training data
scaler.fit(X_train)

# 2. Transform both train and test sets
X_train_scaled = scaler.transform(X_train)
X_test_scaled = scaler.transform(X_test)
Why? Your model should never learn anything from the test set during training, and that includes the min, max, mean, and std of the test data.
Pro-Tip: Interpreting Your Results
After you make predictions on scaled data, the results will also be on that scaled dimension. If you need to interpret them in their original units (e.g., dollars), use the inverse_transform method.
Pythonoriginal_predictions = scaler.inverse_transform(scaled_predictions)
Conclusion: A Simple Step with a Huge Impact
Choosing between Standardization vs Normalization isn’t just an academic question; it’s a practical decision that impacts your model’s performance. Feature scaling is a quick but essential step that ensures your model treats all features fairly, leading to faster convergence and more accurate results.
Mastering this fundamental data preprocessing step shows you care about data quality and model integrity—skills that are highly valued in any data science role.
Ready to apply these skills to real-world projects and build a portfolio that stands out? At Kaashiv Infotech, our Data Science and Machine Learning courses and internships are designed to take you from theory to production-ready skills.
FAQ (Frequently Asked Questions)
- When should you use Standardization vs Normalization?
Use Standardization as a default, especially if your data has outliers or if your algorithm assumes a zero-centered distribution. Use Normalization when you need features in a specific bounded range (like 0-1) or if your data is not Gaussian. - Is feature scaling always necessary?
No. Tree-based models like Random Forest and XGBoost are not sensitive to the scale of features. However, for distance-based or gradient-based algorithms (like KNN, SVM, Linear Regression), it is essential. - Does Standardization make data normal?
No, this is a common misconception. Standardization centers the data (mean=0, std=1) but does not change the shape of the distribution itself. If your data was skewed before, it will still be skewed after. - What is the difference between StandardScaler and MinMaxScaler?
StandardScalerimplements Standardization (Z-score scaling), creating a distribution with a mean of 0 and a standard deviation of 1.MinMaxScalerimplements Normalization, scaling the data to a fixed range, typically [0, 1]. - Should I scale my target variable?
Generally, no. You should only scale your input features (X). The target variable (y) should remain in its original units so you can properly interpret your model’s predictions.