Generalized Linear Models (GLM): A Beginner-Friendly Guide to Modern Statistical Modeling
Generalized Linear Models (GLMs) form one of the most important foundations in statistics and data science. If you’ve ever wondered how machines predict probabilities, classify outcomes, or model counts like “number of users per day,” GLMs are often working behind the scenes. This guide takes you from the basics to a deeper understanding in a smooth, beginner-friendly way—without overwhelming you.
Understanding the Idea Behind GLMs
At its core, a Generalized Linear Model is an extension of simple linear regression. Traditional linear regression works well when your output is continuous—like predicting salary or temperature. But the real world is rarely that simple.
Sometimes you need to predict:
- Whether an email is spam or not
- How many customers will visit a store
- The probability that a patient has a disease
These are not continuous values. They are binary outcomes, counts, or probabilities. A simple straight-line model cannot handle these correctly because it may produce invalid outputs—like negative probabilities or impossible counts.
GLMs solve this problem by introducing flexibility. Instead of forcing everything into a straight line, they adapt based on the nature of the data.
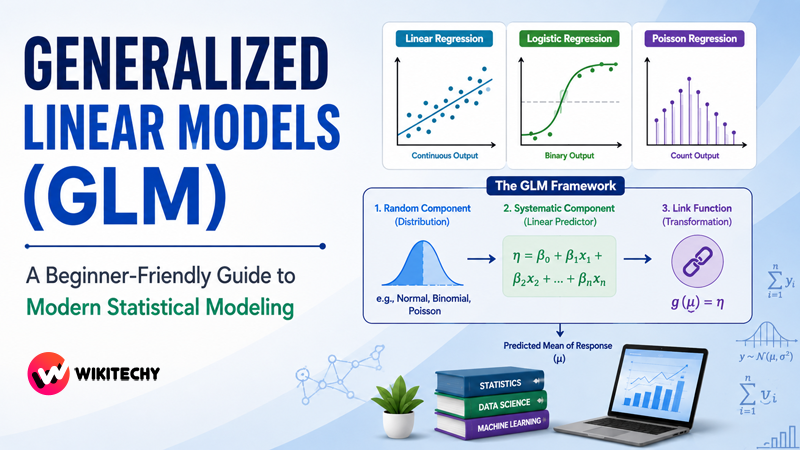
The Structure of a GLM
A GLM is built using three interconnected components. Understanding these clearly is the key to mastering GLMs.
The Random Component
This defines how your output variable behaves. In simple terms, it tells you what kind of data you are working with. For example, if your output is binary (yes/no), you use a binomial distribution. If it’s count data, you might use a Poisson distribution. If it’s continuous, the normal distribution works well.
The Systematic Component
This is the familiar part. It’s just a linear combination of input variables—similar to what you see in linear regression. You take your features, multiply them by coefficients, and add them together to form a predictor.
The Link Function
This is where the magic happens. The link function connects the linear predictor to the expected value of the output. It transforms the result so that it fits the nature of the data.
For instance, if you are predicting probabilities, the link function ensures that the output always stays between 0 and 1.
Why GLMs Are So Important
In real-world data science, assumptions of normal distribution and constant variance often fail. That’s where GLMs shine. They allow you to model data more realistically.
Imagine trying to predict whether a student passes or fails using linear regression. You might get outputs like 1.3 or -0.2, which don’t make sense. GLMs, through proper link functions, ensure that outputs stay meaningful.
They are also highly interpretable. Each coefficient tells you how a feature influences the outcome, which is extremely useful in domains like healthcare and finance where decisions must be explainable.
Exploring the Main Types of GLMs
Linear Regression (The Starting Point)
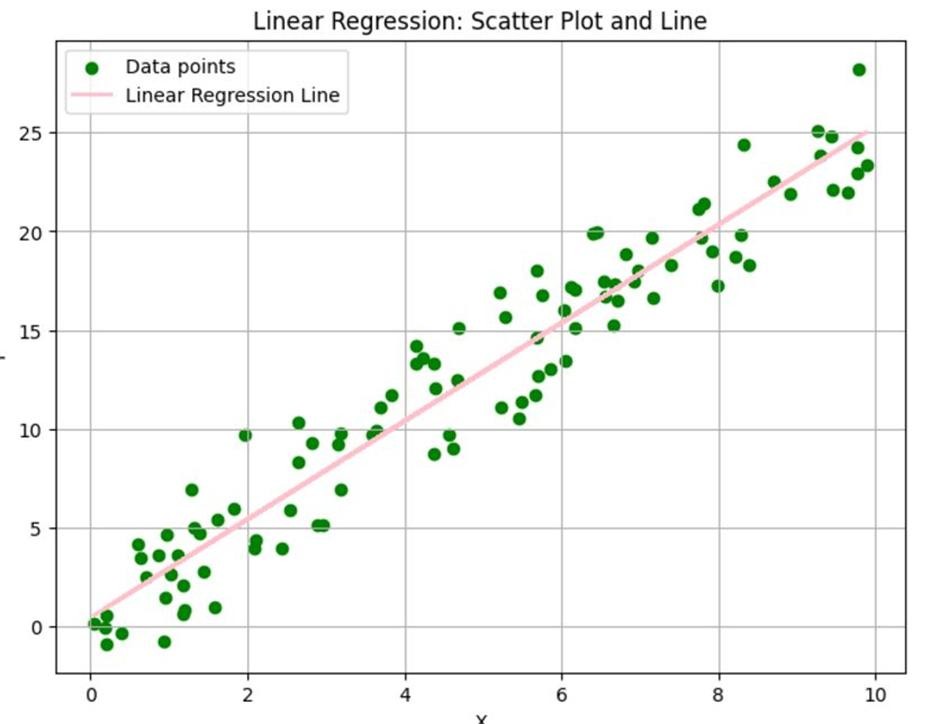
Linear regression is actually a special case of GLM. It assumes a normal distribution and uses an identity link function, meaning no transformation is applied.
It works beautifully when predicting continuous values like house prices or exam scores. However, it struggles when data becomes categorical or discrete.
Logistic Regression (For Classification)
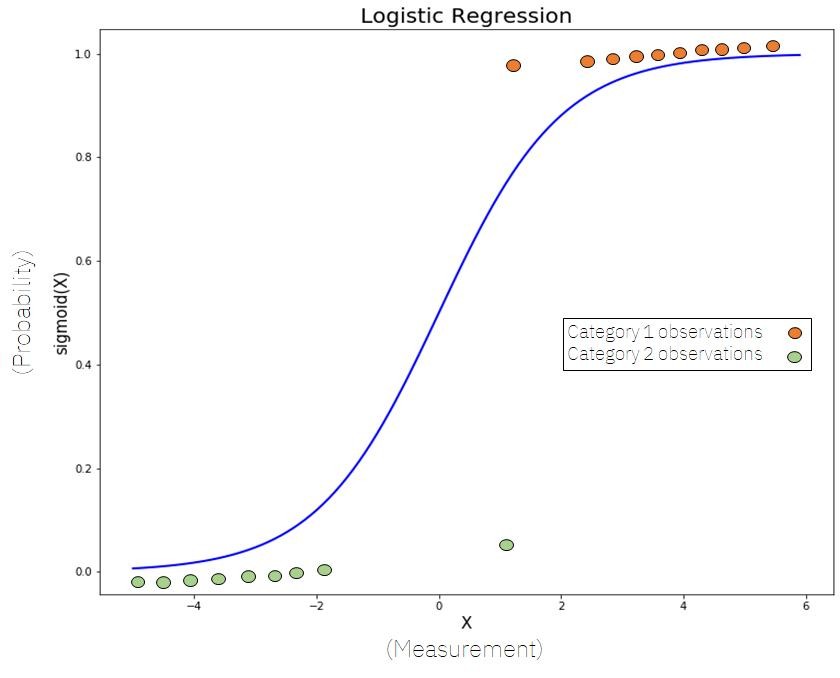
Logistic regression is one of the most widely used GLMs. It is designed for classification problems where the output is binary.
Instead of predicting raw values, it predicts probabilities. These probabilities are then mapped to classes (like 0 or 1).
The transformation used here is the logit function:
log(1−pp)=β0+β1x1+⋯+βnxn
This ensures the output remains within the valid probability range.
Poisson Regression (For Count Data)
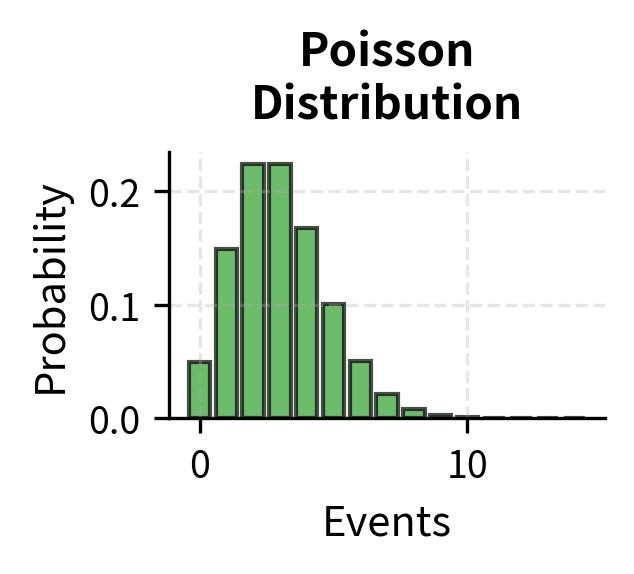
Poisson regression is used when the output represents counts—like the number of visitors to a website or the number of accidents in a city.
It uses a logarithmic transformation to ensure predictions are always positive:
log(λ)=β0+β1x1+⋯+βnxn
This makes it ideal for modeling real-world event frequencies.
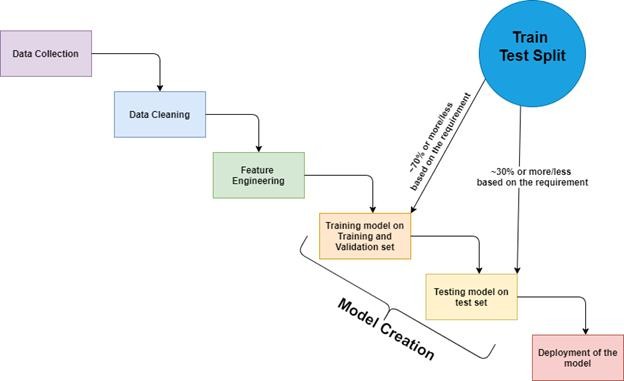
How GLMs Work in Practice
When you train a GLM, the model learns the best coefficients that connect your input variables to the output. Instead of minimizing simple squared error (like in linear regression), GLMs use a method called maximum likelihood estimation.
In simple terms, the model tries to find parameters that make the observed data most probable.
This process allows GLMs to adapt to different types of data distributions while maintaining a consistent framework.
Advantages of GLMs
GLMs are popular not just because they are powerful, but because they strike a balance between simplicity and flexibility. They allow you to handle different types of data without jumping into overly complex models.
They are also highly interpretable. In industries like banking or healthcare, where decisions must be justified, this transparency becomes a major advantage.
Another strength is their strong mathematical foundation, which makes them reliable and widely accepted.
Limitations You Should Know
Despite their strengths, GLMs are not perfect. They assume that relationships are linear in the transformed space, which may not always hold true.
They also require you to choose the correct distribution. If you pick the wrong one, your model performance can drop significantly.
For highly complex patterns, modern machine learning models like neural networks or ensemble methods may perform better.
Real-World Applications of GLMs

GLMs are used everywhere—from predicting diseases to optimizing marketing campaigns.
In healthcare, they help estimate the probability of illnesses. In finance, they are used to assess credit risk. In marketing, they predict whether a user will click an ad or make a purchase.
Even simple systems like spam filters often rely on logistic regression, which is a type of GLM.
A Simple Python Example
To make things more concrete, here’s how you might build a GLM using Python:
import statsmodels.api as sm
import numpy as np

X = np.array([[1], [2], [3], [4]])
y = np.array([0, 0, 1, 1])

X = sm.add_constant(X)

model = sm.GLM(y, X, family=sm.families.Binomial())
result = model.fit()

print(result.summary())
This example shows a basic logistic regression model using the GLM framework.
When Should You Use GLMs?
GLMs are ideal when your target variable is not purely continuous and when interpretability matters. They are especially useful when you want a statistically sound model that is easy to explain and deploy.
They are often the first step before moving into more complex machine learning techniques.
Final Thoughts
Generalized Linear Models are not just another algorithm—they are a complete framework that connects multiple statistical models under one idea. Once you understand GLMs, you begin to see patterns in data modeling that were previously hidden.
They teach you how to think about data distributions, transformations, and relationships in a deeper way.
Conclusion
If you’re starting your journey in data science, mastering GLMs is one of the smartest moves you can make. They build your intuition, strengthen your fundamentals, and prepare you for advanced topics in machine learning.
GLMs are simple enough to learn, yet powerful enough to solve real-world problems. That combination is what makes them truly valuable.
Want to learn more ??, Kaashiv Infotech Offers Data Analytics Course, Data Science Course, Cyber Security Course & More Visit Their Website www.kaashivinfotech.com.