
PANDAS DATAFRAME is one of the first concepts I would recommend learning if you’re getting into Python data analysis, data science, machine learning, or analytics.
PANDAS DATAFRAME might sound like another complicated Python term at first. Honestly, I felt the same way when I first came across pandas. But once I understood that a DataFrame is basically a table of data with rows and columns, everything became much easier.
Think about an Excel spreadsheet.
You have:
- Rows
- Columns
- Column names
- Different types of data
- A way to filter and sort information
A Pandas DataFrame gives you a similar experience, but inside Python — and with a lot more power.
If you’re a beginner, don’t worry. In this guide, I’ll explain what a Pandas DataFrame is, how to create one, how to access rows and columns, how to filter data, and how DataFrames are used in real-world projects.
🔑 Key Highlights
- Pandas DataFrame stores data in rows and columns.
- It is similar to an Excel spreadsheet or SQL table.
- You can create a DataFrame using Python dictionaries, lists, NumPy arrays, and other data sources.
- You can filter, sort, update, delete, and analyze data.
- Pandas can read data from CSV, Excel, SQL, JSON, Parquet, and other sources.
loc[]andiloc[]are commonly used for selecting data.groupby()helps summarize data by categories.read_csv()is one of the most useful functions when working with real datasets.- DataFrames are widely used in data analysis and machine learning workflows.
What Is a Pandas DataFrame?
Let’s make this as simple as possible.
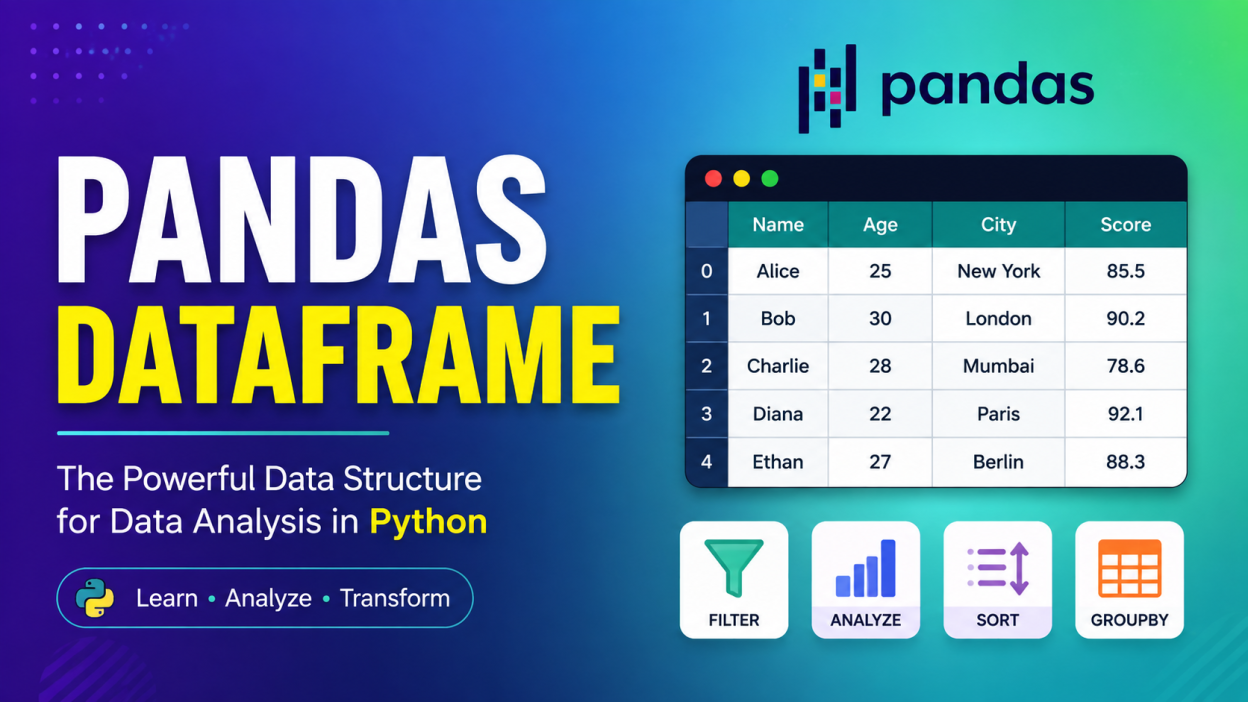
A Pandas DataFrame is a table.
For example, imagine I have student information:
| Name | Age | Course |
|---|---|---|
| Arun | 22 | Python |
| Priya | 23 | Data Science |
| Rahul | 21 | Machine Learning |
This table can be represented as a Pandas DataFrame.
The official pandas documentation describes a DataFrame as a two-dimensional, size-mutable, potentially heterogeneous tabular data structure with labeled rows and columns.
That’s a fancy definition.
I prefer to remember it this way:
DataFrame = Python table
That’s it. 🙂
Once you understand that idea, most of the beginner-level Pandas DataFrame concepts become much easier.
Why Do We Need a Pandas DataFrame?
You might wonder:
“Why can’t I just use Python lists?”
You absolutely can use lists for small tasks.
But imagine you have a CSV file containing 100,000 customer records.
You want to:
- Find customers from Chennai
- Calculate average purchase value
- Remove duplicate records
- Find missing values
- Sort customers by spending
- Group customers by city
- Create charts
Doing all this manually with normal Python lists would quickly become messy.
This is where Pandas DataFrame becomes extremely useful.
Pandas is designed for working with tabular data, such as data from spreadsheets and databases. Its tools cover tasks such as filtering, cleaning, summarizing, reshaping, joining and plotting data.

How to Install Pandas in Python
Before creating a Pandas DataFrame, we need pandas installed.
If you’re using pip, run:
pip install pandasThe official pandas documentation also provides pip and conda installation options.
Then import pandas:
import pandas as pdYou will see pd used everywhere in pandas examples.
Why?
Because pd is simply a commonly used shortcut or alias for the pandas library.
So instead of writing:
pandas.DataFrame()we normally write:
pd.DataFrame()Much shorter.
How to Create a Pandas DataFrame
There are several ways to create a Pandas DataFrame.
Let’s start with the easiest one.
1. Creating a Pandas DataFrame Using a Dictionary
import pandas as pd

data = {
    "Name": ["Arun", "Priya", "Rahul"],
    "Age": [22, 23, 21],
    "Course": ["Python", "Data Science", "Machine Learning"]
}

df = pd.DataFrame(data)

print(df)
The output will look similar to:
    Name  Age             Course
0   Arun   22            Python
1  Priya   23      Data Science
2  Rahul   21  Machine Learning
Notice something interesting.
We didn’t manually create the row numbers.
Pandas automatically gives rows an index, starting from 0 by default when no other index is supplied.
So:
0 → Arun
1 → Priya
2 → Rahul
These are called index labels.
Understanding Rows, Columns and Index
This is one part beginners often mix up.
Look at this:
    Name    Age    Course
0   Arun    22     Python
1   Priya   23     Data Science
2   Rahul   21     Machine Learning
Here:
Columns:
Name
Age
Course
Rows:
Arun
Priya
Rahul
Index:
0
1
2
The index identifies each row. Pandas allows the index to contain integers, strings, or other hashable labels.
Think of the DataFrame like an Excel sheet where every row has an identifier.
How to Display a Pandas DataFrame
Simply use:
print(df)But when you’re working in Jupyter Notebook, you can often just write:
dfand pandas will display the table neatly.
I personally prefer using Jupyter Notebook when learning pandas because you can immediately see what your DataFrame looks like after every operation.
How to Access a Column in Pandas DataFrame
Suppose we have:
df = pd.DataFrame({
    "Name": ["Arun", "Priya", "Rahul"],
    "Age": [22, 23, 21],
    "Course": ["Python", "Data Science", "Machine Learning"]
})
To access the Name column:
print(df["Name"])To access the Age column:
print(df["Age"])You can also sometimes use:
df.NameBut I recommend learning the bracket notation first:
df["Name"]It is more explicit and works with column names that aren’t valid Python attribute names.
How to Access Multiple Columns
Suppose I only want Name and Age.
I can write:
print(df[["Name", "Age"]])Notice the double square brackets.
The outer brackets select from the DataFrame, while the inner list contains the column names.
This is a small syntax detail, but beginners frequently get confused by it.
How to Access Rows in a Pandas DataFrame
There are two important tools you should learn:
loc[]
and
iloc[]
Don’t try to memorize complicated definitions initially.
Think about them like this:
loc[]→ works mainly with labelsiloc[]→ works mainly with integer positions
For example:
df.loc[0]gets the row with index label 0.
And:
df.iloc[0]gets the first row by position.
This distinction becomes especially useful when your DataFrame has a custom index.
How to Filter Data in Pandas DataFrame
Now we reach one of my favorite parts.
Suppose our DataFrame contains:
data = {
    "Name": ["Arun", "Priya", "Rahul", "Sneha"],
    "Age": [22, 23, 21, 25],
    "Marks": [85, 92, 78, 95]
}

df = pd.DataFrame(data)
I want students whose marks are greater than 80.
I can write:
result = df[df["Marks"] > 80]

print(result)
That’s incredibly useful.
Instead of manually checking every student, pandas performs the filtering for us.
We can also use multiple conditions.
For example:
df[(df["Marks"] > 80) & (df["Age"] < 25)]How to Add a New Column to Pandas DataFrame
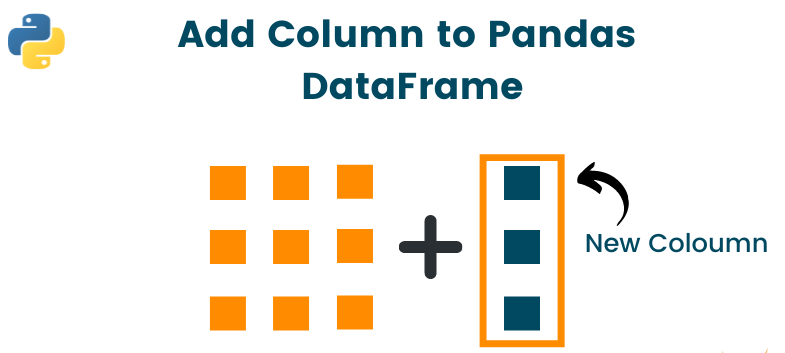
Suppose I want to add a Result column.
df["Result"] = "Pass"Now every row gets:
Result
Pass
Pass
Pass
Pass
We can also create a column based on another column.
For example:
df["Bonus_Marks"] = df["Marks"] + 5Pandas performs column operations element-wise, which means you often don’t need to write a loop through every row for simple calculations.
That’s one reason I find pandas so convenient.
How to Remove a Column
Suppose I no longer need Bonus_Marks.
I can use:
df = df.drop("Bonus_Marks", axis=1)Here:
axis=1means we’re operating on a column.
You will also come across:
axis=0which generally refers to the row axis.
At first, axis can feel confusing. Don’t worry about memorizing every detail on day one. You’ll naturally get comfortable with it as you practice.
How to Sort a Pandas DataFrame
Suppose I want to sort students by marks.
df.sort_values("Marks")This sorts the DataFrame by the Marks column.
For descending order:
df.sort_values("Marks", ascending=False)Now the highest marks appear first.
This is particularly useful when working with:
- Sales data
- Employee data
- Student results
- Product prices
- Customer transactions
Reading a CSV File Using Pandas DataFrame
This is where pandas becomes much more practical.
Imagine I have a file called:
students.csvI can load it using:
df = pd.read_csv("students.csv")That’s it.
I now have the CSV data inside a Pandas DataFrame.
Pandas supports reading and writing several common data formats and sources, including CSV, Excel, SQL, JSON and Parquet.
For example:
df = pd.read_excel("students.xlsx")And for CSV:
df = pd.read_csv("students.csv")This is one of the first things I’d practice if you’re learning pandas for a job.

Useful Pandas DataFrame Functions for Beginners
Once you’ve created your Pandas DataFrame, these functions become your everyday toolkit.
head()
Shows the first few rows.
df.head()tail()
Shows the last few rows.
df.tail()shape
Shows the number of rows and columns.
df.shapeFor example:
(100, 5)means:
100 rows
5 columns
columns
Shows column names.
df.columnsinfo()
Provides useful information about the DataFrame.
df.info()describe()
Provides summary statistics for appropriate numeric columns.
df.describe()These are simple commands, but I strongly recommend practicing them until they become second nature.
Pandas DataFrame and Missing Values
Real-world datasets are rarely perfect.
You might find:
Name    Age    Salary
Arun    25     50000
Priya   NaN    60000
Rahul   28     NaN
NaN generally indicates missing data.
Pandas provides tools for detecting and handling missing values.
For example:
df.isnull()You can count missing values:
df.isnull().sum()You can also remove rows containing missing values:
df.dropna()Or fill missing values:
df.fillna(0)In a real project, though, I wouldn’t blindly replace every missing value with zero. First, I’d ask:
Why is the value missing?
That’s an important data-analysis habit.
Using groupby() with Pandas DataFrame
groupby() is another concept worth learning.
Suppose I have sales data:
| Employee | Department | Sales |
| Arun | IT | 50000 |
| Priya | HR | 30000 |
| Rahul | IT | 70000 |
| Sneha | HR | 40000 |
I want total sales by department.
I can use:
df.groupby("Department")["Sales"].sum()The result gives me the total sales for each department.
Pandas supports summary statistics and grouped calculations using the split-apply-combine approach.
If you’re coming from SQL, groupby() will probably feel familiar.
Pandas DataFrame vs Excel
A simple comparison makes this easier.
| Excel | Pandas DataFrame |
| Worksheet | DataFrame |
| Row | Row |
| Column | Column |
| Cell | Individual value |
| Filter | Boolean filtering |
| Sort | sort_values() |
| Pivot Table | pivot() / pivot_table() |
| Formula | Python/pandas expression |
I’m not saying pandas replaces Excel completely.
It doesn’t.
But when the dataset becomes large or the analysis needs to be repeated through code, pandas becomes incredibly useful.
Pandas DataFrame vs SQL Table
A Pandas DataFrame is also quite similar to a SQL table conceptually.
For example, SQL might have:
SELECT *
FROM Students
WHERE Marks > 80;
In pandas, a similar filtering idea is:
df[df["Marks"] > 80]Pandas documentation specifically provides guidance for people coming from SQL, including equivalents for operations such as SELECT, GROUP BY, and JOIN.
So if you’re already learning SQL, don’t think of pandas as a completely unrelated topic.
There are connections.
Where Is Pandas DataFrame Used?
You will see Pandas DataFrame in many areas of technology.
📊 Data Analysis
Analysts use DataFrames to clean, filter, summarize and explore datasets.
🤖 Machine Learning
Before feeding data into a machine-learning model, we often need to clean and prepare it.
Pandas is commonly used during that preparation stage.
💰 Finance
Financial datasets contain large amounts of structured information, making DataFrames useful for analysis.
🛒 E-commerce
Imagine an online store with millions of transactions.
A DataFrame can help analyze:
- Products
- Orders
- Revenue
- Customers
- Discounts
- Sales trends
🏥 Healthcare
DataFrames can help organize and analyze structured healthcare datasets.
Of course, real healthcare applications require appropriate privacy, security and compliance controls. A DataFrame itself doesn’t make sensitive data safe.
Common Pandas DataFrame Mistakes Beginners Make
I’ve noticed that beginners often try to memorize hundreds of pandas functions immediately.
I wouldn’t recommend that.
Start with these:
pd.DataFrame()
pd.read_csv()
df.head()
df.tail()
df.info()
df.describe()
df.shape
df["column"]
df.loc[]
df.iloc[]
df.sort_values()
df.groupby()
df.dropna()
df.fillna()
Once you’re comfortable with these, move forward.
Also, don’t just watch tutorials.
Create a small dataset yourself.
For example:
data = {
    "Name": ["Asha", "Ravi", "Meena"],
    "Age": [24, 26, 23],
    "Salary": [45000, 55000, 50000]
}

df = pd.DataFrame(data)
Then challenge yourself:
- Find the average salary.
- Find employees earning more than ₹50,000.
- Sort by salary.
- Add a new column.
- Find the oldest employee.
That kind of practice sticks much better than simply reading syntax.
Pandas DataFrame: What Should You Learn Next?
If you’re learning Pandas DataFrame as part of a larger Python or data-science journey, I’d follow this order:
Step 1: Python Basics
Learn:
- Variables
- Lists
- Dictionaries
- Functions
- Loops
- Conditions
Step 2: NumPy Basics
Understand arrays and basic numerical operations.
Step 3: Pandas DataFrame
Learn:
- Creating DataFrames
- Reading CSV files
- Selecting columns
- Selecting rows
- Filtering
- Sorting
- Missing values
- Adding/removing columns
Step 4: Intermediate Pandas
Then move to:
groupby()merge()concat()pivot()pivot_table()- String operations
- Date/time operations
Step 5: Data Visualization
Then learn tools such as:
- Matplotlib
- Seaborn
Pandas also provides plotting functionality that works with Matplotlib.
Final Thoughts on Pandas DataFrame
When I first explain Pandas DataFrame to beginners, I avoid starting with the technical definition.
I start with the table.
That’s because a DataFrame really does feel like a programmable table.
You can create it.
You can filter it.
You can sort it.
You can clean it.
You can calculate values.
You can combine it with other DataFrames.
And eventually, you can turn that cleaned data into charts or feed it into a machine-learning workflow.
If you’re completely new to pandas, don’t try to learn everything in one day. Start with DataFrame(), read_csv(), head(), column selection, filtering and groupby().
Once those feel comfortable, the rest starts making much more sense. 😊
My advice: open a Jupyter Notebook, create one small DataFrame, and start experimenting. Change the values. Add a column. Filter a row. Break something. Fix it. That’s how pandas really starts to click. 🚀
Want to Learn More About Python & Artificial Intelligence ?, Kaashiv Infotech Offers Full Stack Python Course, Artificial Intelligence Course, Data Science Course & More Visit Their Website course.kaashivinfotech.com.