
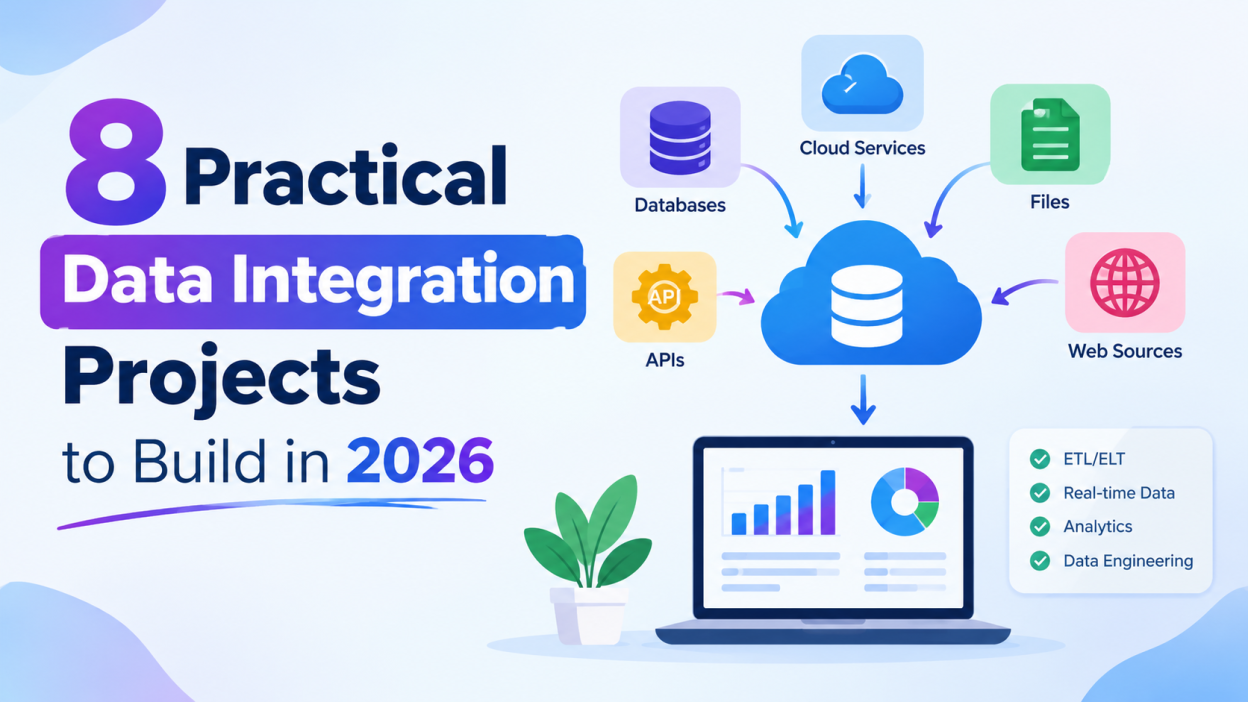
Data plays an important role in almost every modern business. Companies collect information from websites, mobile applications, customer relationship management (CRM) platforms, databases, cloud services, and business applications. However, this information is often stored in different formats and locations. To make better decisions, businesses need a reliable way to bring all these sources together. This process is known as data integration.
Data integration combines information from multiple sources into a unified system where it can be accessed, analyzed, and used effectively. It helps businesses reduce manual work, improve data quality, and generate useful insights. In 2026, data integration is especially important for organizations adopting cloud computing, artificial intelligence, machine learning, and real-time analytics.
For students and aspiring data engineers, building data integration projects is an excellent way to develop practical skills. These projects provide experience with APIs, databases, data pipelines, cloud platforms, and automation tools.
In this article, we will explore eight practical data integration project ideas that you can build in 2026, ranging from beginner-friendly applications to advanced data engineering solutions.
What Is Data Integration?
Data integration is the process of collecting information from different sources and combining it into a consistent, usable format. For example, an online store might maintain customer details in a CRM system, product information in a database, and payment records in a separate application. Integrating these sources allows the business to understand its overall performance in one place.
Common data integration techniques include Extract, Transform, Load (ETL), Extract, Load, Transform (ELT), API integration, database replication, and real-time streaming.
Popular tools and technologies for these tasks include Python, SQL, Apache Airflow, Apache Kafka, PostgreSQL, and cloud data warehouses. The best choice depends on the project’s complexity, data volume, and business requirements.
8 Best Data Integration Project Ideas in 2026
1. Customer Data Integration System

A customer data integration system collects customer information from multiple platforms and combines it into a single database. Businesses often store customer names, email addresses, purchase histories, and support requests in separate systems.
In this project, you can build an application that collects customer information from CSV files, website forms, and APIs. Using Python and Pandas, clean the data, remove duplicate records, standardize names, and combine customer information into a unified database.
Tools required: Python, Pandas, MySQL or PostgreSQL, and REST APIs.
Key features:
- Import customer data from different sources.
- Identify duplicate customer records.
- Standardize email addresses and phone numbers.
- Generate a unified customer profile.
- Create reports showing customer activity.
This beginner-friendly project helps you understand data cleaning, transformation, database management, and record matching. It is useful for businesses that want to improve customer service and marketing activities.
2. Real-Time Sales Data Integration Pipeline
Sales information comes from online stores, physical shops, payment gateways, and inventory systems. Integrating these sources helps businesses understand sales performance and monitor transactions.
For this project, build a pipeline that collects sales records from different sources and updates a centralized database. Python can handle data extraction, while Apache Kafka can transfer transaction events when you want to implement real-time processing.
The system can combine order details, product information, payment status, and inventory records. A dashboard built with Power BI or Tableau can display revenue, popular products, and daily sales trends.
Tools required: Python, SQL, Apache Kafka, PostgreSQL, and Power BI.
Key features:
- Collect sales records from multiple platforms.
- Combine transaction and product information.
- Identify failed or duplicate transactions.
- Update sales reports automatically.
- Display revenue and product performance.
This intermediate project introduces event streaming and analytics. You can begin with CSV files and scheduled updates before adding real-time processing.
3. Weather Data Integration and Analysis Platform
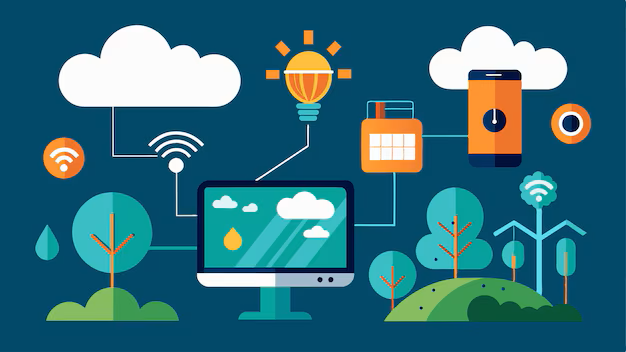
A weather data integration platform combines information from weather APIs, historical datasets, and location databases. It can help users compare weather conditions across different cities and analyze changes over time.
Start by connecting to a weather API that provides temperature, humidity, wind speed, and rainfall information. Extract the JSON responses using Python, transform them into structured records, and store them in a database.
You can also integrate historical weather data from CSV files to compare current conditions with previous observations.
Tools required: Python, REST APIs, Pandas, PostgreSQL, and Streamlit.
Key features:
- Collect weather information for multiple cities.
- Combine current and historical weather records.
- Convert timestamps into a consistent format.
- Store daily weather measurements.
- Visualize temperature and rainfall trends.
This project is suitable for beginners who want hands-on experience with APIs, structured data, and visualization. It can also be extended into a forecasting application by adding a machine learning model.
4. E-Commerce Data Integration and Analytics System
E-commerce businesses use separate platforms for product catalogs, customer orders, payments, shipping, and inventory. Integrating these systems provides a complete view of the purchasing process.
In this project, create a data pipeline that imports product information from one source, order records from another, and shipping updates from an API. Transform the data into consistent formats and connect related records using customer IDs, order IDs, and product IDs.
Store the integrated information in a relational database or cloud data warehouse. Build a dashboard to show order status, customer spending, product demand, and delivery performance.
Tools required: Python, SQL, REST APIs, PostgreSQL, and Power BI.
Key features:
- Integrate product, order, and payment data.
- Track orders from purchase to delivery.
- Compare sales with available inventory.
- Identify popular products and delayed shipments.
- Generate automated business reports.
This project is valuable for aspiring data engineers because it demonstrates how multiple business systems can work together through a structured data pipeline.
5. Cloud-Based ETL Data Integration Pipeline
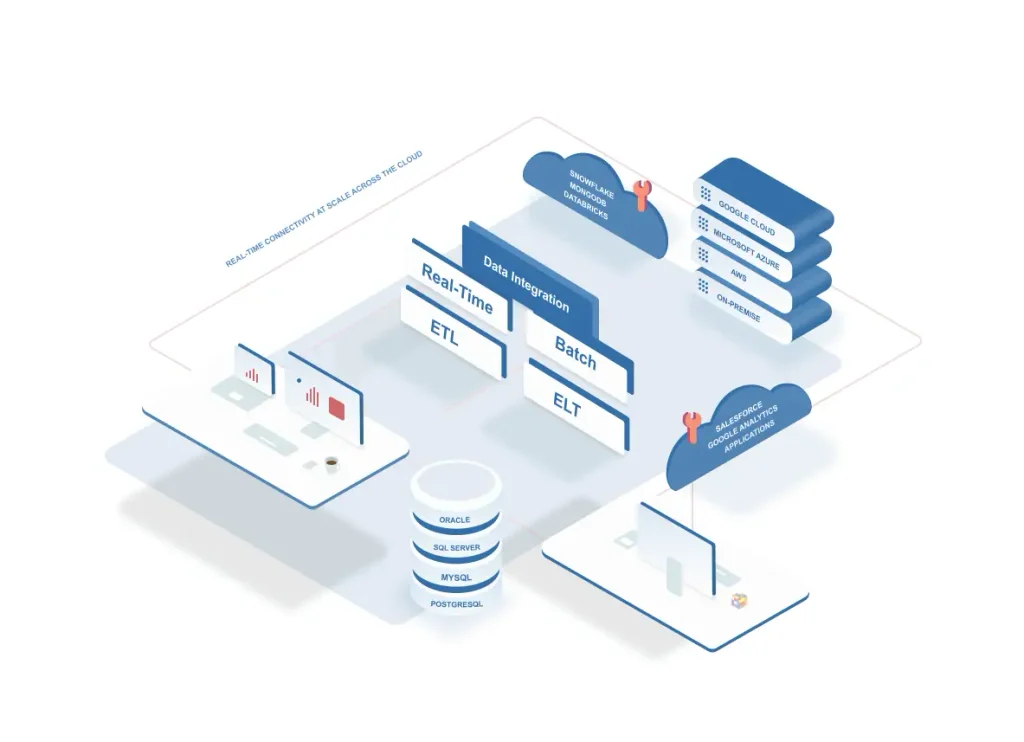
An ETL pipeline extracts data from different sources, transforms it into a consistent format, and loads it into a destination system. Businesses use ETL pipelines to prepare data for reporting, analysis, and machine learning.
For this project, collect information from CSV files, databases, and APIs. Use Python to clean and transform the information, then load the processed data into a cloud data warehouse or database.
You can use Apache Airflow to schedule tasks, manage dependencies, and monitor pipeline execution. Airflow is designed to orchestrate ETL and ELT workflows across different data systems.
Tools required: Python, SQL, Apache Airflow, AWS S3, and a cloud data warehouse.
Key features:
- Extract data from multiple sources.
- Validate and transform incoming records.
- Load clean data into cloud storage.
- Schedule recurring pipeline executions.
- Track failed tasks and retry processing.
Begin with a local database and CSV files. Once the pipeline works, move the storage layer to a cloud platform. This project is particularly useful for students preparing for data engineering roles.
6. Social Media Data Integration and Sentiment Analysis
Social media platforms generate information about user engagement, comments, reactions, and content performance. Combining these records can help businesses understand how audiences respond to their products and campaigns.
Build an application that collects permitted public or account-authorized data through available APIs. Integrate post details, timestamps, engagement metrics, and comments into a central database.
Next, use a natural language processing library to classify eligible text as positive, negative, or neutral. A dashboard can display engagement trends and sentiment distributions.
Tools required: Python, authorized social media APIs, Pandas, PostgreSQL, and a visualization tool.
Key features:
- Import social media engagement metrics.
- Combine data from multiple supported sources.
- Clean text and standardize timestamps.
- Perform basic sentiment classification.
- Compare engagement and sentiment trends.
This project combines data integration with text analytics. Make sure you follow platform API permissions, rate limits, and privacy requirements. Avoid collecting private messages or personal information without authorization.
7. Financial Data Integration and Expense Tracking System
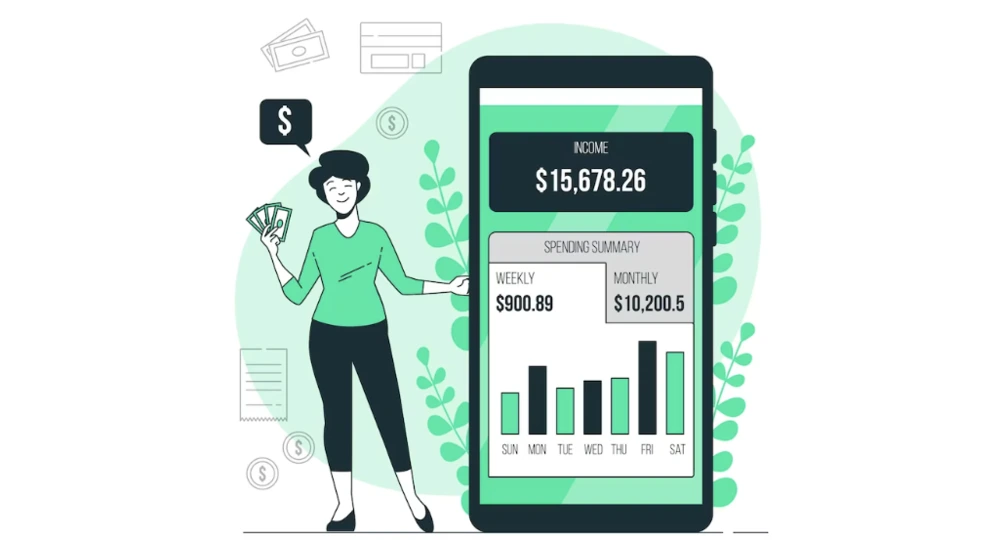
Financial information may be spread across bank transaction exports, expense spreadsheets, invoices, and budgeting applications. Integrating these records helps users understand spending patterns and organize financial reports.
Create a system that imports sample bank transactions from CSV files and expense records from spreadsheets. Normalize dates, currencies, transaction descriptions, and category names before combining the records.
You can build a categorization feature that groups expenses into categories such as groceries, transport, education, subscriptions, and utilities. A dashboard can summarize monthly expenses and compare spending across categories.
Tools required: Python, Pandas, SQL, and Power BI or Tableau.
Key features:
- Import transaction and expense records.
- Standardize dates and monetary values.
- Categorize expenses automatically or manually.
- Identify duplicate transactions.
- Generate monthly spending reports.
Use synthetic or properly anonymized financial data for development. Do not store real banking credentials or sensitive transaction details unnecessarily.
This project is a practical way to learn data normalization, validation, aggregation, and reporting.
8. IoT Sensor Data Integration and Monitoring System
Internet of Things (IoT) devices produce data continuously through temperature sensors, humidity monitors, smart meters, and industrial equipment. Integrating these data streams allows organizations to monitor equipment and identify unusual conditions.
In this advanced project, simulate multiple sensors or connect to authorized devices. Collect sensor readings and send them to a central processing system. Apache Kafka can handle event streaming, while Python or Apache Spark can process incoming records.
Store the processed measurements in a database and create a dashboard that displays current readings and historical trends. Add alerts when sensor values cross predefined thresholds.
Tools required: Python, MQTT, Apache Kafka, PostgreSQL, and Grafana.
Key features:
- Collect data from multiple simulated sensors.
- Combine readings using device IDs and timestamps.
- Detect missing or invalid measurements.
- Display near-real-time sensor information.
- Trigger alerts for abnormal readings.
This project helps you understand streaming pipelines, time-series data, monitoring, and event-driven architectures. You can expand it by integrating machine learning to identify unusual sensor behavior.
How to Choose the Right Data Integration Project
The best project depends on your current knowledge and career goals.
| Skill level | Recommended project | Main skills |
|---|---|---|
| Beginner | Customer data integration | Python, Pandas, SQL |
| Beginner | Weather data platform | APIs, JSON, visualization |
| Intermediate | E-commerce integration | Database joins, ETL, dashboards |
| Intermediate | Sales data pipeline | Kafka basics, SQL, analytics |
| Intermediate | Financial data integration | Data cleaning, reporting |
| Advanced | Cloud ETL pipeline | Airflow, cloud storage |
| Advanced | Social media analytics | APIs, NLP, data processing |
| Advanced | IoT monitoring system | Streaming, MQTT, monitoring |
Tips for Building a Successful Data Integration Project
Start with a clearly defined problem and select two or three data sources. Build the simplest working pipeline first, then add more sources and automation.
Pay attention to data quality. Check for missing values, duplicate records, inconsistent formats, and incorrect timestamps. Add logging and error handling so you can identify pipeline failures.
Document the project architecture and explain how data moves from source to destination. Include a sample dataset, database schema, screenshots, and setup instructions in your GitHub repository. If possible, demonstrate the final output with a dashboard.
A complete project that includes data extraction, transformation, validation, storage, and monitoring will demonstrate more practical knowledge than a script that only copies data between files.
Conclusion
Data integration is an important part of modern data engineering because it turns information scattered across different systems into data that businesses can actually use. From customer databases and sales analytics to cloud ETL pipelines and IoT monitoring, these eight project ideas offer practical opportunities to develop technical skills in 2026.
If you are a beginner, start with customer data integration or a weather data platform. As your skills improve, explore cloud-based ETL, real-time streaming, and advanced monitoring systems.
Focus on building a complete, reliable solution rather than simply using many tools. With consistent practice and clear documentation, your data integration projects can become valuable portfolio examples for internships and data engineering positions.
Want to learn more ??, Kaashiv Infotech Offers Data Analytics Course, Data Science Course, Cyber Security Course & More Visit Their Website www.kaashivinfotech.com.