
There are plenty of ways you can get the lowdown on memory usage within your Linux system. In this roundup, we’ll cover the most commonly used command-line methods: free, vmstat, and top. We’ll also look at reading /proc/meminfo directly.
Table Of Content
How Linux Uses RAM
RAM is a finite resource that all processes, like applications and daemons, want a piece of. There’s only so much of it available. The kernel referees the memory squabbles and allocates the rationed memory out to all the hungry processes. It’s kind of like a mother bird with more open beaks pointed at her than she has the grub for.
Unused RAM is wasted RAM. Linux uses any spare RAM for things like file buffer space, to keep your computer running at optimum performance. It’s easy to get the impression that your system’s RAM has been consumed by some runaway process or memory leak, but that’s rarely the case.
It’s usually just the kernel tenaciously doing its job in the background. If there are other demands for the RAM that the kernel has poached for its own devices, it relinquishes the memory instantly, so there’s no harm done.
If the kernel decides it’s more efficient to start using swap space, it brings that into play, as well. There’s a lot of confusion about the swappiness value in Linux and when the kernel will start using swap. It’s untrue that the swappiness value sets a threshold for RAM usage that triggers swap to be enabled.
But now, let’s look at the different techniques you can use in the terminal window to see the RAM usage on your Linux computer.
The free Command
The free command gives you a table of the total, used, free, shared, buffer/cache, and available RAM on your computer. It also shows you the total amount of swap space configured.
In our example, we’ll use the -m (mebibytes) option. However, you could also use -b (bytes), -k (kibibytes), or -g (gibibytes).
We type the following command:
[pastacode lang=”sql” manual=”free%20-m” message=”” highlight=”” provider=”manual”/]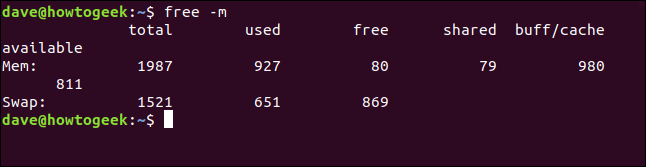
This is the output we get:
[pastacode lang=”sql” manual=”%20%20%20%20%20%20total%20used%20free%20shared%20buff%2Fcache%20available%0AMem%3A%20%20%201987%20%20901%20%20%2095%20%20%20%20%2080%20%20%20%20%20%20%20%20990%20%20%20%20%20%20%20811%0ASwap%3A%201521%20%20%20651%20%20869%0A” message=”” highlight=”” provider=”manual”/]The Mem columns contain the following information:
- Total: The total amount of physical RAM on this computer.
- Used: The sum of Free+Buffers+Cache subtracted from the total amount.
- Free: The amount of unused memory.
- Shared: Amount of memory used by the tmpfs file systems.
- Buff/cache: Amount of memory used for buffers and cache. This can be released quickly by the kernel if required.
- Available: This is an estimate of the memory that’s available to service memory requests from applications and any other operational software on your computer.
The Swap columns contain the following information:
- Total: The size of the swap partition or file.
- Used: The amount of swap space that’s in use.
- Free: The amount of remaining (unused) swap space.
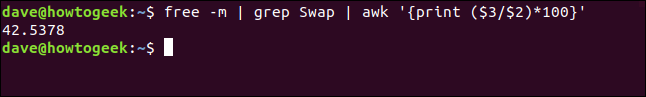
It’s impossible to have a good understanding of the way RAM is used in your Linux box without an appreciation of the state of your swap space. RAM and swap space work closely together.
You can use the vmstat command to take a deeper dive into how your swap space (or virtual memory) is being used. It gives you a report on a variety of based on the average values since the last reboot.
Type the following:
[pastacode lang=”sql” manual=”vmstat” message=”” highlight=”” provider=”manual”/]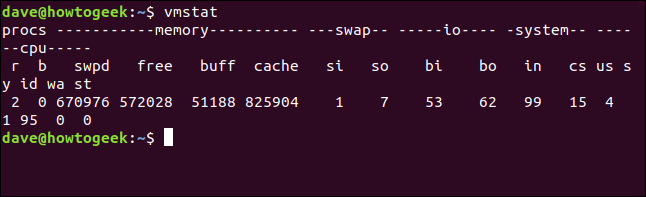
This is the output without the wrap-around:
[pastacode lang=”sql” manual=”procs%20———–memory———-%20—swap–%20—–io—-%20-system–%20——cpu—–%0Ar%20b%20%20%20%20swpd%20%20%20%20free%20%20buff%20%20%20cache%20%20%20si%20%20so%20%20%20%20bi%20%20%20bo%20%20%20%20in%20%20%20cs%20%20us%20sy%20id%20wa%20st%0A3%200%20%20671488%20%20576084%20%2051088%20%20823876%20%20%201%20%20%207%20%20%20%2053%20%20%2062%20%20%20%2099%20%20%2014%20%20%204%20%201%2095%20%200%20%200%0A” message=”” highlight=”” provider=”manual”/]There are a lot of data points in that report, so we’ll break them down:
- Proc:
r: The number of “runnable” processes. They’re either running or waiting for their next time-sliced burst of CPU cycles.
b: The number of processes in uninterruptible sleep. These aren’t sleeping, but performing a blocking system call. They can’t be interrupted until they complete their current action. Typically, this process is a device driver waiting for some resource to be free. Any queued interrupts for that process are handled when the process resumes its usual activity.
- Memory:
- swpd: The amount of virtual memory used, i.e., how much memory has been swapped out.
- free: The amount of idle (unused) memory.
- buff: The amount of memory used as buffers.
- cache: The amount of memory used as cache.
- Swap
- si: The amount of virtual memory swapped in from swap space.
- so: The amount of virtual memory swapped out to swap space.
- IO:
-
- bi: Blocks in. The number of data blocks used to swap virtual memory back to RAM.
- bo: Blocks out. The number of data blocks used to swap virtual memory out of RAM and into swap space.
- System:
- in: The number of interrupts per second, including the clock.
- cs: The number of context switches per second. A context switch is when the kernel swaps from system to user mode processing.
- CPU: These values are all percentages of the total CPU time:
- us: Time spent running user (non-kernel) code.
- sy: Time spent running kernel code.
- id: Time spent idle.
- wa: Time spent waiting for in- or output.
- st: The time a virtual machine has to wait for the hypervisor to finish servicing other virtual machines before it can come back and attend to this virtual machine.
The top Command
The top command displays a screen packed with information. The values are updated every few seconds.
To use it, we type the following:
[pastacode lang=”sql” manual=”top” message=”” highlight=”” provider=”manual”/]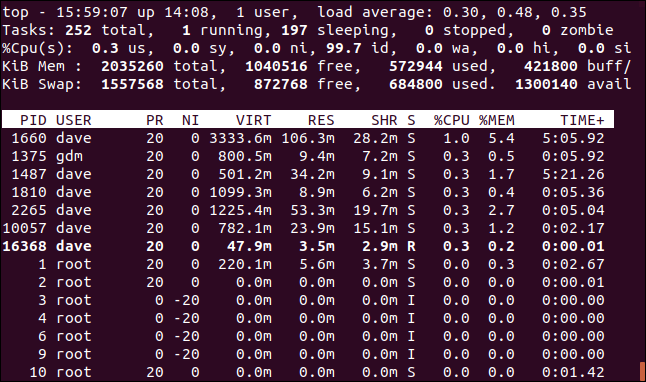
The “e” key was pressed. This changed the display to megabytes, which are easier to visually parse than long strings representing bytes. There are five lines of information at the top of the screen and a lower pane with columns of data.
- Line one:The time, how long the computer has been running, how many people are logged in, and what the load average has been over the past one, five, and 15 minutes.
- Line two:The number of tasks and their states: running, stopped, sleeping, or zombie.
- Line three:CPU information (see the breakdown of the fields below).
- Line four: The total amount of physical memory, and how much is free, used, buffered, or cached.
- Line five:Total amount of swap memory, and how much is free, used and available (taking into account memory that’s expected to be recoverable from caches).
The CPU fields on line three are as follows:
- us:Time the CPU spends executing processes for users in user space.
- sy:Time the CPU spent running system “kernel space” processes.
- ni:Time the CPU spent executing processes with a manually set nice value.
- id:CPU idle time.
- wa:Time the CPU spends waiting for I/O to complete.
- hi:Time the CPU spent servicing hardware interrupts.
- si:Time the CPU spent servicing software interrupts.
- st (steal time):Time the CPU lost due to running virtual machines.
You might have to press the left or right arrow keys to see all the columns. The values in each column are described below:
- PID:Process ID.
- USER:Name of the owner of the process.
- PR:Process priority.
- NI:The nice value of the process.
- VIRT:Virtual memory used by the process.
- RES:Resident memory used by the process.
- SHR:Shared memory used by the process.
- S:Status of the process. (See the list of values this field can take below).
- %CPU:The share of CPU time used by the process since the last update.
- %MEM:The share of physical memory used.
- TIME+:Total CPU time used by the task in 100ths of a second.
- COMMAND:The Command name or line (name + options). (This column is offscreen to the right in the image above.)
The status displayed in the S column can be one of the following:
- D:Uninterruptible sleep.
- R:
- S:
- T:Traced (stopped).
- Z:
Press Q to exit top.
Reading /proc/meminfo
[pastacode lang=”sql” manual=”less%20%2Fproc%2Fmeminfo” message=”” highlight=”” provider=”manual”/]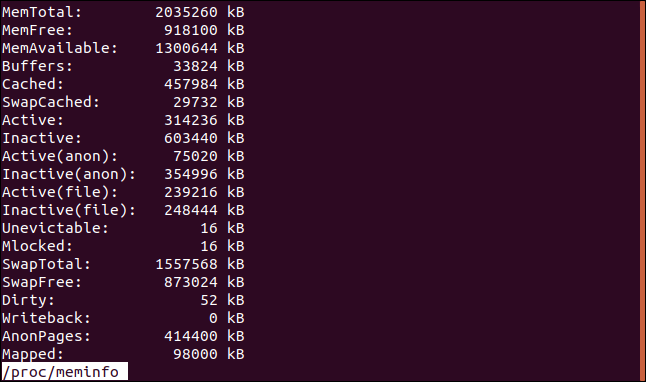
All sizes are in kibibytes unless otherwise indicated. Here’s what they all mean, along with some others you might see depending on your computer’s configuration and hardware:
- MemTotal: Total usable RAM (apart from a few reserved bits and the kernel binary code).
- MemFree: The sum of LowFree+HighFree. The amount of RAM currently available.
- MemAvailable: Estimated memory available to start new applications, without swapping.
- Buffers: Temporary storage for raw disk blocks. This reduces hard drive in- and output. It also speeds up access to subsequent requests for the same data because it’s already in memory.
- Cached: Cached pages read from files on the hard drive (not including SwapCached).
- SwapCached: Memory that was swapped out and back in, and a copy remains in the swap space.
- Active: Memory used recently. It’s not reclaimed unless absolutely necessary.
- Inactive: Memory that’s been used, but not the most recently used. It’s a likely candidate for reclamation.
- Active(anon): Memory allocated to files created in a tmpfs pseudo-file system. Anonymous files don’t reside on the hard drive.
- Inactive(anon): Amount of anonymous, tmpfs, and shmem memory that’s a candidate for eviction (memory reclamation).
- Active(file): Amount of file cache memory in use, or that has been used since the previous memory reclamation cycle.
- Inactive(file): Amount of file cache memory read from a hard drive that is a candidate for reclaiming.
- Unevictable: Amount of memory that should be evictable, but isn’t because it’s locked into memory by user-space processes.
- Mlocked: Total amount of memory not evictable because it’s locked by user-space processes.
- HighTotal: Total amount of HighMem, which is used by user-space programs and page cache. The kernel can access this memory zone, but it’s slower for it to access than LowMem.
- HighFree: Amount of free HighMem.
- LowTotal: Amount of LowMem, which is available for all the same uses as HighMem, but also for the kernel to use for its own purposes.
- LowFree: Amount of free LowMem.
- MmapCopy: Amount of memory that’s been mapped to file data.
- SwapTotal: Total amount of swap space available.
- SwapFree: Amount of swap space that’s currently unused.
- Dirty: Amount of memory waiting to be written back to the disk.
- Writeback: Memory actively being written back to the disk.
- AnonPages: Non-file backed pages mapped into user-space page tables.
- Mapped: Files (like libraries) that are mapped into memory.
- Shmem: Amount of memory consumed in tmpfs pseudo-file systems.
- KReclaimable: Kernel memory allocations the kernel will attempt to reclaim if the demand for memory is severe enough.
- Slab: In-kernel data structures cache.
- SReclaimable: Amount of Slab memory that might be reclaimed, such as caches.
- SUnreclaim: Amount of Slab memory that can’t be reclaimed.
- KernelStack: Amount of memory allocated to kernel stacks.
- PageTables: Amount of memory dedicated to the lowest level of page tables.
- Quicklists: Because the allocation and deletion of page tables is a very frequent operation, it’s vital that’s it’s as quick as possible. So, the pages used for page tables are cached in a number of different lists called “quicklists.”
- NFS_Unstable: (NFS) pages the server has received, but not yet written to non-volatile storage.
- Bounce: Memory used for block device bounce buffers. A bounce buffer is positioned in memory low enough for a device to directly access it. The data is then copied to the desired user page in HighMem.
- WritebackTmp: Memory used by (FUSE) for temporary write-back buffers.
- CommitLimit: The total amount of memory currently available to be allocated in the system.
Committed_AS: The amount of memory estimated to satisfy all current demands. If a program requests some RAM, the request is recorded, but the RAM is only allocated once the program starts to use it. It’s also only allocated as required, up to the maximum amount the program reserved. More memory can be “allocated” than can actually be delivered. If all programs try to cash in their RAM chips at once, the memory casino might go bust (and have to go cap in hand to the swap-space financiers).
- VmallocTotal: Total size of the vmlloc memory area.
- VmallocUsed: Amount of vmalloc area used. Since Linux 4.4, this field is no longer calculated, it’s hard-coded.
- VmallocChunk: Largest contiguous block of free vmalloc area.
- HardwareCorrupted: Amount of memory tagged as having physical memory corruption problems. It won’t be allocated.
- LazyFree: Amount of memory in MADV_FREE state. When an application sets the MADV_FREEflag on a range of pages and they’re now reclamation candidates. Actual reclamation might be delayed until there’s sufficient demand for memory. If the application starts to write to pages, the reclamation can be canceled.
- AnonHugePages: Non-file backed huge pages mapped into user-space page tables. Non-file backed pages didn’t come from a hard drive file.
- ShmemHugePages: Amount of memory used by shared memory (shmem) and pseudo-file systems (tmpfs) allocated with huge pages.
- ShmemPmdMapped: Amount of shared memory mapped into user-space with huge pages.
- CmaTotal: Amount of CMA (Contiguous Memory Allocator) pages. These are used by devices that can only communicate to contiguous regions of memory.
- CmaFree: Amount of free CMA (Contiguous Memory Allocator) pages.
- HugePages_Total: Huge page pool size.
- HugePages_Free: Number of unallocated huge pages in the pool.
- HugePages_Rsvd: Number of reserved huge pages. The commitment to allocate has been made, but allocation hasn’t occurred yet.
- HugePages_Surp: Number of huge pages in the pool above the defined system value.
- Hugepagesize: Size of huge pages.
- DirectMap4k: Number of bytes of RAM mapped to 4 kB pages.
- DirectMap4M: Number of bytes of RAM mapped to 4 MB pages.
- DirectMap2M: Number of bytes of RAM mapped to 2 MB pages.
- DirectMap1G: Number of bytes of RAM mapped to 2 GB pages.
Linux, there’s more than one way to get a quick overview, and always at least one way to go deeper into the details.


