Google Chart - google chart tutorial - Basic Line Chart with Customizable background color - chart js - google graphs - google charts examples
What is Basic Line Chart?
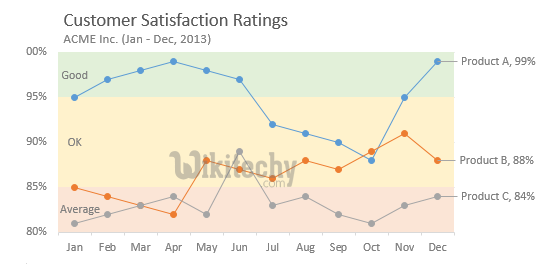
- Basic line chart is based on the area chart and the line between axis and area is filled with colors to indicate volume
- Basic Line charts are used for drawing line and spline based charts which are done in Basic Line Charts.
- Basic Line charts are used to compare changes over time between two groups
- Basic Line Chart have system changes when the measure shows a complete shift to a different level
- Basic Line Chart have variations in both the normal range in which data is expected to fluctuate over time and outlying data points that merit investigating the data points.
Learn google charts - google charts tutorial - basic-line-chart-with-customizable-background-color - google charts examples - google charts programs
Basic Line Chart with Customizable background color Configuration
- The code which is given below shows us the configuration for basic line chart with customizable background color and we have added backgroundColor configuration to change default background color.
Code:
// Set chart options
var options = {
   backgroundColor: '#f1f8e9'
};
Clicking "Copy Code" button to copy the code. From - google charts tutorial - team
- The program which is given below shows us the full program of basic line chart with customizable background color which is used.
Program:
googlecharts-line-background.html
 Tryit<html>
<head>
<title>Google Charts Tutorial</title>
   <script type="text/javascript" src="https://www.gstatic.com/charts/loader.js"></script>
   <script type="text/javascript">
     google.charts.load('current', {packages: ['corechart','line']});
   </script>
</head>
<body>
<div id="container" style="width: 550px; height: 400px; margin: 0 auto"></div>
<script language="JavaScript">
function drawChart() {
   // Define the chart to be drawn.
   var data = new google.visualization.DataTable();
   data.addColumn('string', 'Month');
   data.addColumn('number', 'Tokyo');
   data.addColumn('number', 'New York');
   data.addColumn('number', 'Berlin');
   data.addColumn('number', 'London');
   data.addRows([
      ['Jan',  7.0, -0.2, -0.9, 3.9],
      ['Feb',  6.9, 0.8, 0.6, 4.2],
      ['Mar',  9.5,  5.7, 3.5, 5.7],
      ['Apr',  14.5, 11.3, 8.4, 8.5],
      ['May',  18.2, 17.0, 13.5, 11.9],
      ['Jun',  21.5, 22.0, 17.0, 15.2],
      ['Jul',  25.2, 24.8, 18.6, 17.0],
      ['Aug',  26.5, 24.1, 17.9, 16.6],
      ['Sep',  23.3, 20.1, 14.3, 14.2],
      ['Oct',  18.3, 14.1, 9.0, 10.3],
      ['Nov',  13.9,  8.6, 3.9, 6.6],
      ['Dec',  9.6,  2.5,  1.0, 4.8]
   ]);
   // Set chart options
   var options = {'title' : 'Average Temperatures of Cities',
      hAxis: {
         title: 'Month'
      },
      vAxis: {
         title: 'Temperature'
      },
      'width':550,
      'height':400,
      backgroundColor: '#f1f8e9'
   };

   // Instantiate and draw the chart.
   var chart = new google.visualization.LineChart(document.getElementById('container'));
   chart.draw(data, options);
}
google.charts.setOnLoadCallback(drawChart);
</script>
</body>
</html>