Google Charts - Google Charts tutorial - Stepped Area Chart - chart js - google graphs - google charts examples
What is Stepped Area Chart?
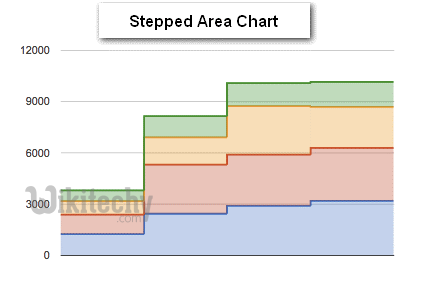
- Stepped area chart which is rendered within the browser using SVG or VML displays tips when hovering over steps
- Stepped Area Charts are like stepped line charts except that the area under the stepped area chart are shaded.
- Stepped Area Charts is used when we want to highlight the increase or decrease in values over time.
- The Stepped Area Chart function reads a data frame and creates text output which refers to the Google Visualisation API which can be included into a web page
- A stepped area chart is also known as a step based area chart
Learn GoogleCharts - GoogleCharts tutorial - stepped area chart graph in google chart - GoogleCharts examples - GoogleCharts programs
The table which is given below tell us about stepped area chart and their description
| S. No. | Chart Type / Description |
|---|---|
| 1 | Basic Stepped Chart Basic Stepped Area Chart |
| 2 | Stacked Stepped Chart Stacked Stepped Area Chart |
| 3 | 100% Stacked Stepped Chart 100% Stacked Stepped Area Chart |