Google Charts - Google Charts tutorial - Sankey Chart - chart js - google graphs - google charts examples
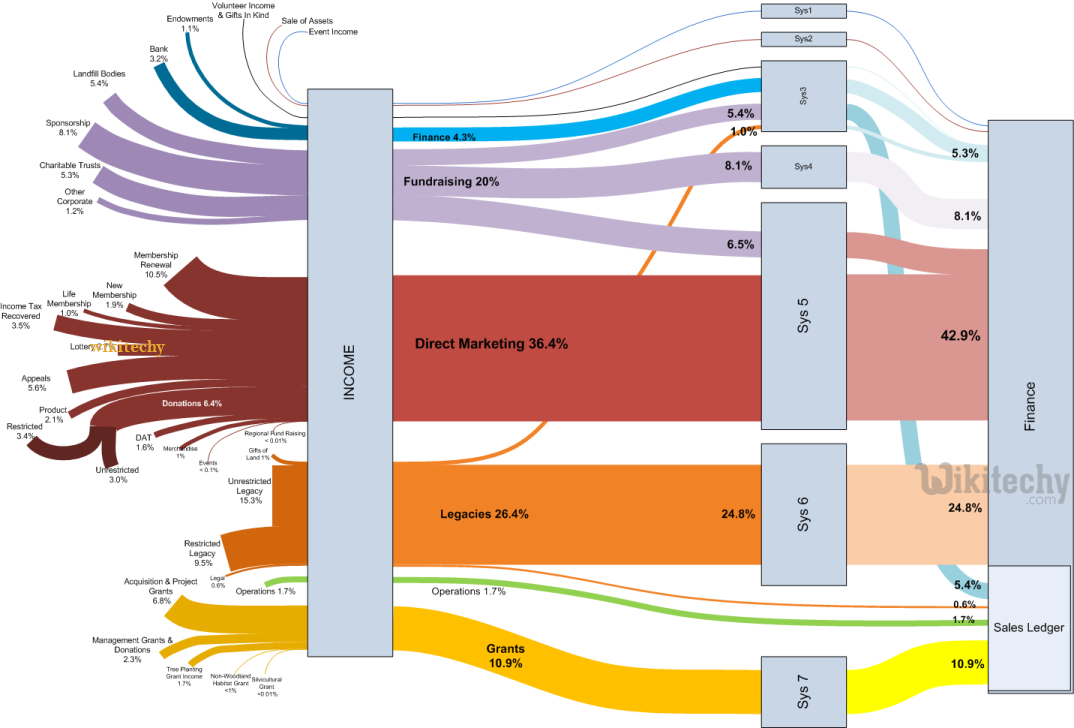
What are Sankey Charts?
- Sankey Chart is a visualization tool and is used to describe a flow from one set of values to another set.
- Sankey Charts are specific type of flow diagram, in which the width of the arrows is shown proportionally to the flow quantity.
- Sankey Charts put a visual emphasis on the flows within a system.
- Sankey Charts are used to represent energy inputs, useful output and wasted output.
- Sankey Charts are used to show many-to-many mapping between multiple paths through the set of stages.
Learn Googlecharts - Googlecharts tutorial - sankey charts graph in google charts - Googlecharts examples - Googlecharts programs
The table below shows us the chart types of Sankey charts and their description.
| S. No. | Chart Type / Description |
|---|---|
| 1 | Basic Sankey Chart Basic Sankey Chart |
| 2 | Multilevel Sankey Chart Multilevel Sankey Chart |
| 3 | Customizing Sankey Chart Customized Sankey Chart |