Google Charts - Google Charts tutorial - Multilevel Sankey Chart - chart js - google graphs - google charts examples
What is Multilevel Sankey Chart?
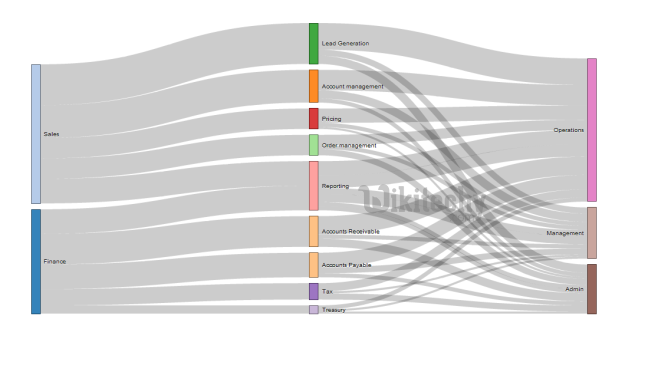
- Multilevel Sankey Diagrams are useful for showing relationships between the different data points
- Multilevel Sankey diagrams are rendered in the browser using SVG or VML which is appropriate for the user's browser.
- Multilevel sankey chart is a visualization used to portray a flow from one set of values to another.and the things which are being connected are called nodes and the connections are called links.
- Multilevel sankey charts are used when we want to show a many-to-many mapping between two domains through a set of stages.
- Multilevel sankey chart provide a set of rows, with each containing information about one connection
Learn Google Charts - Google Charts tutorial - multilevel sankey chart - Google Charts examples - Google Charts programs
Configuration
- The syntax which is given below tells us the configuration of Multilevel Sankey Charts and we have used Sankey class to show sankey diagram.
Syntax:
//Sankey chart
var chart = new google.visualization.Sankey(document.getElementById('container'));
Clicking "Copy Code" button to copy the code. From - google charts tutorial - team
- Here is a sample code which is a sample code of Multilevel Sankey Chart.
Sample Code:
googlecharts-sankey-multilevel.html
 Tryit
<html>
<head>
<title>Wikitechy Google Charts Tutorial</title>
   <script type="text/javascript" src="https://www.gstatic.com/charts/loader.js"></script>
   <script type="text/javascript" src="https://www.google.com/jsapi"></script>
   <script type="text/javascript">
     google.charts.load('current', {packages: ['sankey']});
   </script>
</head>
<body>
<div id="container" style="width: 550px; height: 400px; margin: 0 auto"></div>
<script language="JavaScript">
function drawChart() {
// Define the chart to be drawn.
   var data = new google.visualization.DataTable();
   data.addColumn('string', 'From');
   data.addColumn('string', 'To');
   data.addColumn('number', 'Weight');
   data.addRows([
      [ 'Brazil', 'Paris', 5 ],
      [ 'Brazil', 'France', 1 ],
      [ 'Brazil', 'Spain', 2 ],
      [ 'Brazil', 'China', 3 ],
      [ 'Canada', 'Paris', 4 ],
      [ 'Canada', 'France', 5 ],
      [ 'Canada', 'Spain', 1 ],
      [ 'Mexico', 'Paris', 2 ],
      [ 'Mexico', 'France', 3 ],
      [ 'Mexico', 'Spain', 5 ],
      [ 'Mexico', 'China', 1 ],
      [ 'USA', 'Paris', 2 ],
      [ 'USA', 'France', 3 ],
      [ 'USA', 'Spain', 4 ],
      [ 'USA', 'China', 5 ],
	  [ 'Portugal', 'Angola', 2 ],
      [ 'Portugal', 'japan', 5 ],
      [ 'Portugal', 'Morocco', 4 ],
      [ 'Portugal', 'South Africa', 3 ],
      [ 'France', 'Angola', 1 ],
      [ 'France', 'japan', 3 ],
      [ 'France', 'Mali', 2 ],
      [ 'France', 'Morocco', 4 ],
      [ 'France', 'South Africa', 5 ],
      [ 'Spain', 'japan', 1 ],
      [ 'Spain', 'Morocco', 2 ],
      [ 'Spain', 'South Africa', 3 ],
      [ 'England', 'Angola', 4 ],
      [ 'England', 'japan', 5 ],
      [ 'England', 'Morocco', 2 ],
      [ 'England', 'South Africa', 7 ],
      [ 'South Africa', 'los angeles', 5 ],
      [ 'South Africa', 'India', 2 ],
      [ 'South Africa', 'Malaysia', 3 ],
      [ 'Angola', 'los angeles', 5 ],
      [ 'Angola', 'India', 4 ],
      [ 'Angola', 'Malaysia', 3 ],
      [ 'Senegal', 'China', 5 ],
      [ 'Senegal', 'India', 2 ],
      [ 'Senegal', 'Malaysia', 3 ],
      [ 'Mali', 'los angeles', 5 ],
      [ 'Mali', 'India', 4 ],
      [ 'Mali', 'Malaysia', 3 ],
      [ 'Morocco', 'los angeles', 5 ],
      [ 'Morocco', 'India', 2 ],
      [ 'Morocco', 'Malaysia', 3 ]
   ]);
   // Set chart options
   var options = {
      width: 550
   };
   // Instantiate and draw the chart.
   var chart = new google.visualization.Sankey(document.getElementById('container'));
   chart.draw(data, options);
}
google.charts.setOnLoadCallback(drawChart);
</script>
</body>
</html>