Google Charts - Google Charts tutorial - Customized Candlestick Chart - chart js - google graphs - google charts examples
How to Customize candlestick Charts?
- We can use Google Chart Tools with their default setting - all customization is optional and the basic setup is launch-ready.
- However, charts can be easily customizable in case your webpage adopts a style which is at odds with provided defaults.
- Every chart exposes a number of options that customize its look and feel. These options are expressed as name:value pairs in the options object passed into a chart's draw() method.
- Charts usually support custom options appropriate to that visualization.
Learn Google Charts - Google Charts tutorial - Htmlchart Candlestickchart Simple - Google Charts examples - Google Charts programs
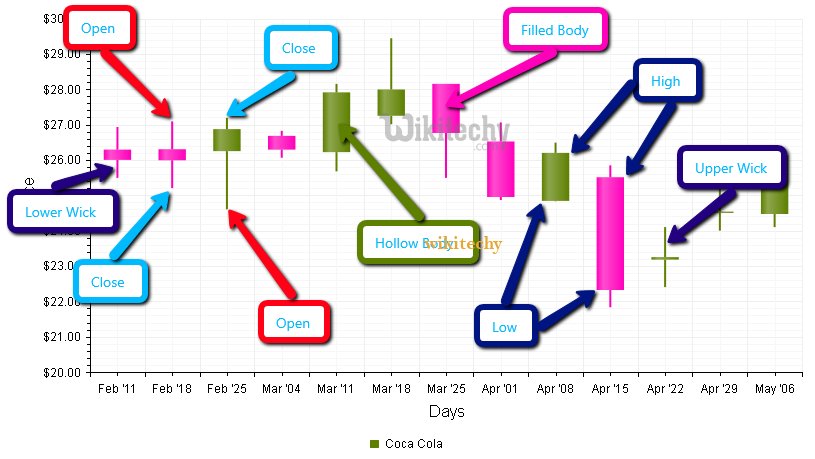
Configurations
- You have used candlestick configuration to customize the calendar.
Syntax
// Set chart options
var options = {
   legend: 'none',
   bar: { groupWidth: '50%' }, // Remove space between bars.
   candlestick: {
      fallingColor: { strokeWidth: 0, fill: '#a52714' }, // red
      risingColor: { strokeWidth: 0, fill: '#0f9d58' }   // green
   }
};
Clicking "Copy Code" button to copy the code. From - google charts tutorial - team
Sample code
googlecharts-candlestick-customized.html
 Tryit<html>
<head>
<title>Google Charts Tutorial - Wikitechy</title>
   <script type="text/javascript" src="https://www.gstatic.com/charts/loader.js"></script>
   <script type="text/javascript">
     google.charts.load('current', {packages: ['corechart']});
   </script>
</head>
<body>
<div id="container" style="width: 550px; height: 400px; margin: 0 auto"></div>
<script language="JavaScript">
function drawChart() {
   // Define the chart to be drawn.
   var data = google.visualization.arrayToDataTable([
      ['Jan', 30, 38, 48, 55],
      ['Feb', 41, 48, 65, 76],
      ['Mar', 60, 65, 87, 90],
      ['Apr', 87, 87, 76, 60],
      ['May', 78, 76, 32, 25]
      // Treat first row as data as well.
    ], true);

   // Set chart options
   var options = {
      legend: 'none',
      bar: { groupWidth: '50%' }, // Remove space between bars.
      candlestick: {
         fallingColor: { strokeWidth: 0, fill: '#0000e6' }, // blue
         risingColor: { strokeWidth: 0, fill: '#ff3385' }   // pink
      }
   };

   // Instantiate and draw the chart.
   var chart = new google.visualization.CandlestickChart(document.getElementById('container'));
   chart.draw(data, options);
}
google.charts.setOnLoadCallback(drawChart);
</script>
</body>
</html>