Google Charts - Google Charts tutorial - Customized Sankey Chart - chart js - google graphs - google charts examples
What is Customized Sankey Chart?
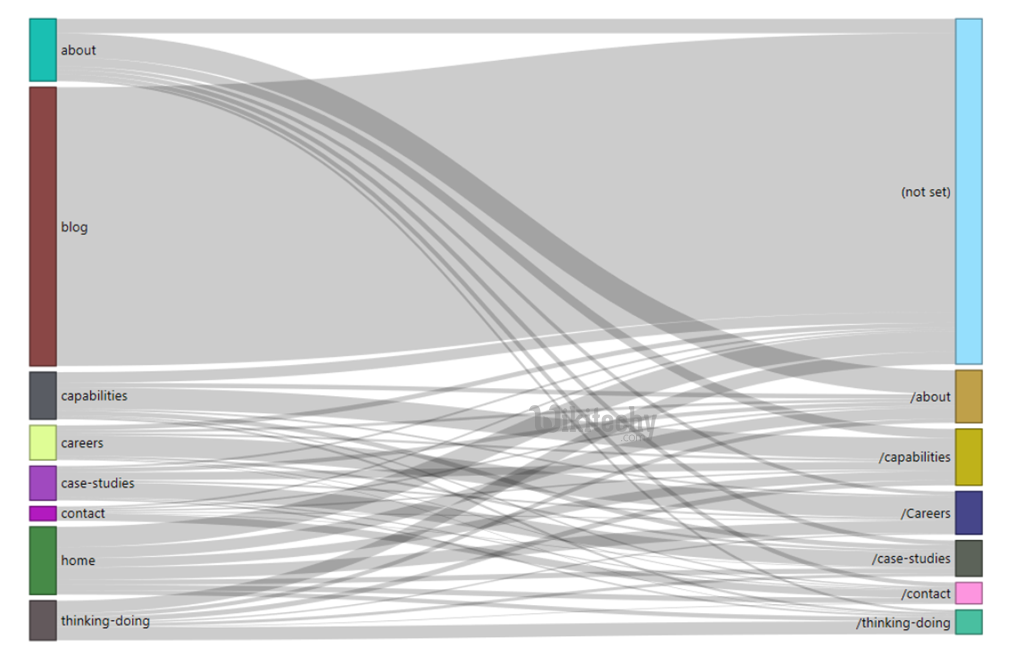
- Customizable Sankey Chart is used to customize the sankey chart which represents all the primary energy flows into a factory.
- Customizable Sankey Chart is customizable which shows the energy efficiency of a steam engine.
- Customizable Sankey Chart illustrates the production and consumption of various forms of energy.
- Customizable Sankey Chart is used to customizable a flow map overlaying a Customizable Sankey chart which is onto a geographical map
- Customizable Sankey Chart will put a visual emphasis on the major flows within a system
Learn google charts - google charts tutorial - google charts customizable sankey chart - google charts examples - google charts programs
Configuration
- The syntax which is given below tell us the configuration of Customizable Sankey Chart and we have used sankey configuration to customized sankey diagram
Syntax:
// Set chart options
var options = {
   width: 550,
   sankey: {
     node: { colors: [ '#a61d4c' ] },
     link: { color: { stroke: 'black', strokeWidth: 1 } },
   }
};
Clicking "Copy Code" button to copy the code. From - google charts tutorial - team
- The sample code which is given below gives us the sample code for Customizable Sankey Chart.
Sample Code:
googlecharts-sankey-customized.html
 Tryit<html>
<head>
<title>Google Charts Tutorial</title>
   <script type="text/javascript" src="https://www.gstatic.com/charts/loader.js"></script>
   <script type="text/javascript" src="https://www.google.com/jsapi"></script>
   <script type="text/javascript">
     google.charts.load('current', {packages: ['sankey']});
   </script>
</head>
<body>
<div id="container" style="width: 550px; height: 400px; margin: 0 auto"></div>
<script language="JavaScript">
function drawChart() {
// Define the chart to be drawn.
   var data = new google.visualization.DataTable();
   data.addColumn('string', 'From');
   data.addColumn('string', 'To');
   data.addColumn('number', 'Weight');
   data.addRows([
      [ 'Brazil', 'China', 5 ],
      [ 'Brazil', 'France', 1 ],
      [ 'Brazil', 'Spain', 2 ],
      [ 'Brazil', 'japan', 3 ],
      [ 'Canada', 'China', 4 ],
      [ 'Canada', 'France', 5 ],
      [ 'Canada', 'japan', 1 ],
      [ 'Mexico', 'China', 2 ],
      [ 'Mexico', 'France', 3 ],
      [ 'Mexico', 'Spain', 5 ],
      [ 'Mexico', 'japan', 1 ],
      [ 'USA', 'China', 2 ],
      [ 'USA', 'France', 3 ],
      [ 'USA', 'Spain', 4 ],
      [ 'USA', 'japan', 5 ]
   ]);
   // Set chart options
   var options = {
      width: 550,
      sankey: {
        node: { colors: [ '#a61d4c' ] },
        link: { color: { stroke: 'black', strokeWidth: 1 } },
      }
   };
   // Instantiate and draw the chart.
   var chart = new google.visualization.Sankey(document.getElementById('container'));
   chart.draw(data, options);
}
google.charts.setOnLoadCallback(drawChart);
</script>
</body>
</html>