Google Charts - Google Charts tutorial - Basic Bar Chart - chart js - google graphs - google charts examples
Overview:
A bar chart that is rendered as an image using the Google Charts API.
Example:
 Tryit<html>
  <head>
    <script type="text/javascript" src="https://www.gstatic.com/charts/loader.js"></script>
    <script type="text/javascript">
      google.charts.load("current", {packages:["imagebarchart"]});
      google.charts.setOnLoadCallback(drawChart);

      function drawChart() {

        var data = google.visualization.arrayToDataTable([
          ['Year', 'Sales', 'Expenses'],
          ['2004',  1000,      400],
          ['2005',  1170,      460],
          ['2006',  660,       1120],
          ['2007',  1030,      540]
        ]);

        var chart = new google.visualization.ImageBarChart(document.getElementById('chart_div'));

        chart.draw(data, {width: 400, height: 240, min: 0});
      }
    </script>
  </head>
  <body>
    <div id="chart_div" style="width: 400px; height: 240px;"></div>
  </body>
</html>
Clicking "Copy Code" button to copy the code. From - google charts tutorial - team
Output:
Loading:
The google.charts.load package name is "imagebarchart"
google.charts.load("current", {packages: [[]"imagebarchart"]});
Clicking "Copy Code" button to copy the code. From - google charts tutorial - team
The visualization's class name is google.visualization.ImageBarChart
var visualization = new google.visualization.ImageBarChart(container);
Clicking "Copy Code" button to copy the code. From - google charts tutorial - team
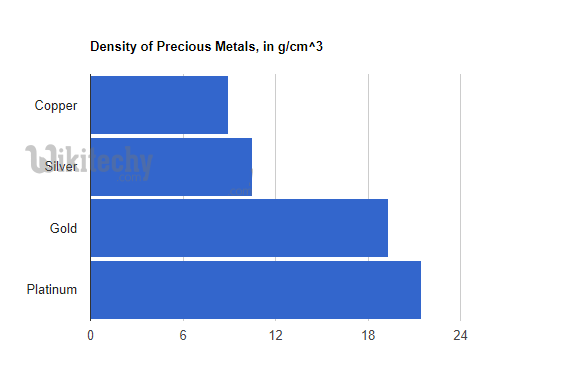
Coloring bars:
Let's chart the densities of four precious metals:
Learn Googlecharts - Googlecharts tutorial - basic bar chart coloring bars in google charts - Googlecharts examples - Googlecharts programs
- Above, all colors are the default blue. That's because they're all part of the same series; if there were a second series, that would have been colored red.
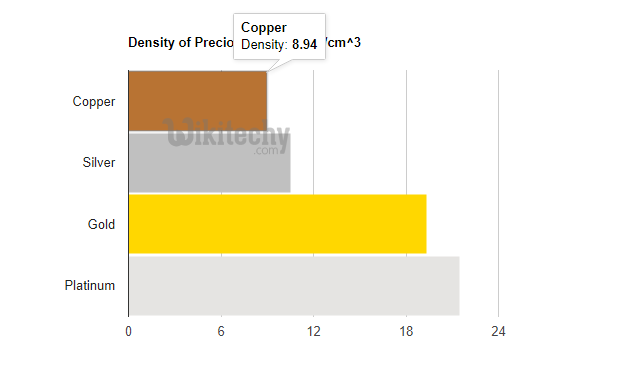
- We can customize these colors with the style role:
Learn Googlecharts - Googlecharts tutorial - basic bar chart customizing bars in googlecharts - Googlecharts examples - Googlecharts programs
There are three different ways to choose the colors, and our data table showcases them all: RGB values, English color names, and a CSS-like declaration:
var data = google.visualization.arrayToDataTable([
         ['Element', 'Density', { role: 'style' }],
         ['Copper', 8.94, '#b87333'],            // RGB value
         ['Silver', 10.49, 'silver'],            // English color name
         ['Gold', 19.30, 'gold'],
         ['Platinum', 21.45, 'color: #e5e4e2' ], // CSS-style declaration
      ]);
Clicking "Copy Code" button to copy the code. From - google charts tutorial - team
Bar styles:
The style role lets you control several aspects of bar appearance with CSS-like declarations:
- color
- opacity
- fill-color
- fill-opacity
- stroke-color
- stroke-opacity
- stroke-width
Learn Googlecharts - Googlecharts tutorial - bar styles in basic bar chart in google chart - Googlecharts examples - Googlecharts programs
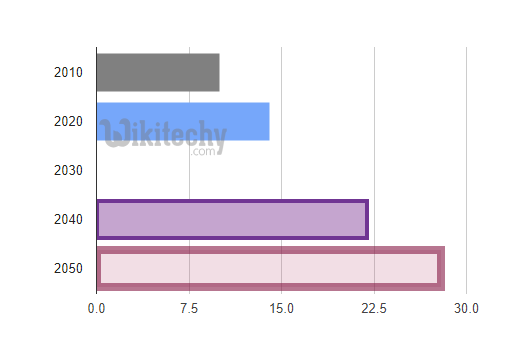
- We don't recommend that you mix styles too freely inside a chart-pick a style and stick with it-but to demonstrate all the style attributes, here's a sampler:
- The first two bars each use a specific color (the first with an English name, the second with an RGB value).
- No opacity was chosen, so the default of 1.0 (fully opaque) is used; that's why the second bar obscures the gridline behind it. In the third bar, an opacity of 0.2 is used, revealing the gridline.
- In the fourth bar, three style attributes are used: stroke-color and stroke-width to draw the border, and fill-color to specify the color of the rectangle inside.
- The rightmost bar additionally uses stroke-opacity and fill-opacity to choose opacities for the border and fill:
   function drawChart() {
      var data = google.visualization.arrayToDataTable([
        ['Year', 'Visitations', { role: 'style' } ],
        ['2010', 10, 'color: gray'],
        ['2020', 14, 'color: #76A7FA'],
        ['2030', 16, 'opacity: 0.2'],
        ['2040', 22, 'stroke-color: #703593; stroke-width: 4; fill-color: #C5A5CF'],
        ['2050', 28, 'stroke-color: #871B47; stroke-opacity: 0.6; stroke-width: 8; fill-color: #BC5679; fill-opacity: 0.2']
      ]);