Google Charts - Google Charts tutorial - Google Charts Basic Area Chart - chart js - google graphs - google charts examples
What is Basic Area Chart?
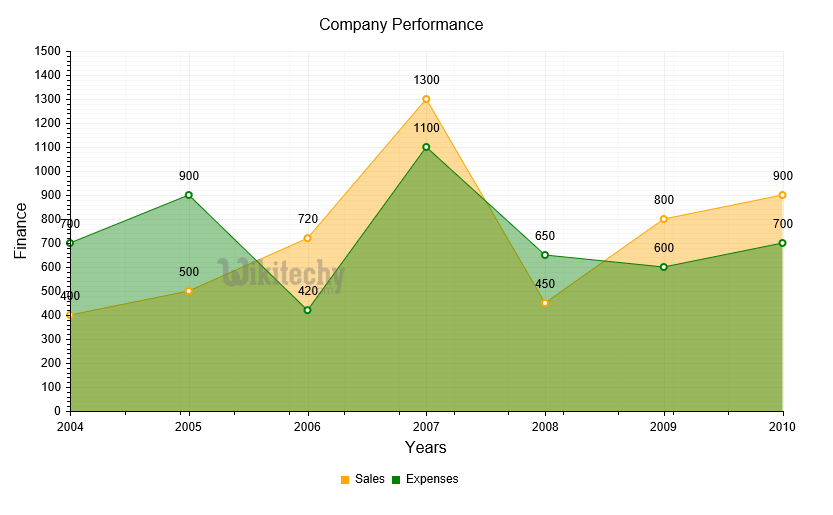
- The basic area chart is based on the line chart and the area between axis and line is filled with colors to indicate volume
- Basic Area charts emphasize the magnitude of change over time, and can be used to draw attention to the total value which is done across a trend.
- Basic area charts are used to see and compare the volume trend across time series
- Basic area charts are used for individual series representing a physically countable set
Learn google charts - google charts tutorial - google charts basic area char - google charts examples - google charts programs
Configuration
- Here the code which is given below shows us the configuration for basic area chart
Sample code:
//area chart
var chart = new google.visualization.AreaChart(document.getElementById('container'));
- The program which is given below shows us the full program of basic area chart which is used.
Learn Google chart - Google chart tutorial - Google area chart - Google chart examples - Google chart programs
Sample code:
googlecharts_area_basic.html
 Tryit
<html>
<head>
<title>Google Charts Tutorial</title>
   <script type="text/javascript" src="https://www.gstatic.com/charts/loader.js"></script>
   <script type="text/javascript">
     google.charts.load('current', {packages: ['corechart']});
   </script>
</head>
<body>
<div id="container" style="width: 550px; height: 400px; margin: 0 auto"></div>
<script language="JavaScript">
function drawChart() {
   // Define the chart to be drawn.
   var data = google.visualization.arrayToDataTable([
      ['Year', 'Sales', 'Expenses'],
      ['2013',  1000,      400],
      ['2014',  1170,      460],
      ['2015',  660,       1120],
      ['2016',  1030,      540]
      ]);

   var options = {
      title: 'Company Performance',
      hAxis: {
         title: 'Year',
         titleTextStyle: {
            color: '#333'
         }
      },
      vAxis: {
         minValue: 0
      }
   };
   // Instantiate and draw the chart.
   var chart = new google.visualization.AreaChart(document.getElementById('container'));
   chart.draw(data, options);
}
google.charts.setOnLoadCallback(drawChart);
</script>
</body>
</html>