Google Charts - Google Charts tutorial - Organization Chart - chart js - google graphs - google charts examples
What is Organization chart?
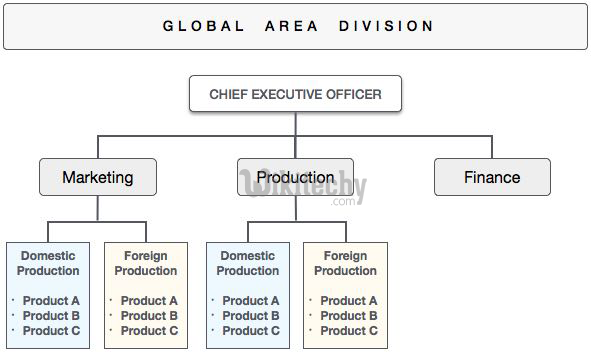
- An organization chart or "org chart" as it's more commonly known, is a diagram that displays a reporting or relationship hierarchy.
- The most frequent application of an org chart is to show the structure of a business, government, or other organization.
- Org charts have a variety of uses, and can be structured in many different ways.
- They might be used as a management tool, for planning purposes, or as a personnel directory.
- For example. Perhaps your organization doesn't operate in a "command and control" style, but instead relies on teams.
learn google charts tutorial - global function - google charts
Configurations:
- We've used OrgChart class to show organization based chart.
Syntax
//organization chart
var chart = new google.visualization.OrgChart(document.getElementById('container'));
Clicking "Copy Code" button to copy the code. From - google charts tutorial - team
learn google charts tutorial - organization charts - google charts
Example:
 Tryit<html>
<head>
<title>wikitechy Google Charts Tutorial</title>
   <script type="text/javascript" src="https://www.gstatic.com/charts/loader.js"></script>
   <script type="text/javascript">
     google.charts.load('current', {packages: ['orgchart']});
   </script>
</head>
<body>
<div id="container" style="width: 650px; height: 500px; margin: 0 auto"></div>
<script language="JavaScript">
function drawChart() {
// Define the chart to be drawn.
   var data = new google.visualization.DataTable();
   data.addColumn('string', 'Name');
   data.addColumn('string', 'Manager');
   data.addColumn('string', 'ToolTip');

   // For each orgchart box, provide the name, manager, and tooltip to show.
   data.addRows([
      [{v:'Robert', f:'Robert<div style="color:red; font-style:italic">President</div>'},'', 'President'],
      [{v:'Jim', f:'Jim<div style="color:red; font-style:italic">Vice President</div>'},'Robert', 'Vice President'],
      ['Alice', 'Robert', ''],
      ['Bob', 'Jim', 'Bob Sponge'],
      ['Carol', 'Bob', '']
   ]);

   // Set chart options
   var options = {allowHtml:true};

   // Instantiate and draw the chart.
   var chart = new google.visualization.OrgChart(document.getElementById('container'));
   chart.draw(data, options);
}
google.charts.setOnLoadCallback(drawChart);
</script>
</body>
</html>