Google Charts - Google Charts tutorial - Material Bar Chart - chart js - google graphs - google charts examples
What is Material bar charts?
- Google announced guidelines intended to support a common look and feel across its properties and apps (such as Android apps) that run on Google platforms. We call this effort Material Design.
- We'll be providing "Material" versions of all our core charts; you're welcome to use them if you like how they look.
- Creating a Material Bar Chart is similar to creating what we'll now call a "Classic" Bar Chart.
- You load the Google Visualization API (although with the 'bar' package instead of the 'corechart' package), define your datatable, and then create an object (but of class google.charts.Bar instead of google.visualization.BarChart).
Note: Material Charts will not work in old versions of Internet Explorer. (IE8 and earlier versions don't support SVG, which Material Charts require.)
Learn google charts - google charts tutorial - google-material-charts - google charts examples - google charts programs
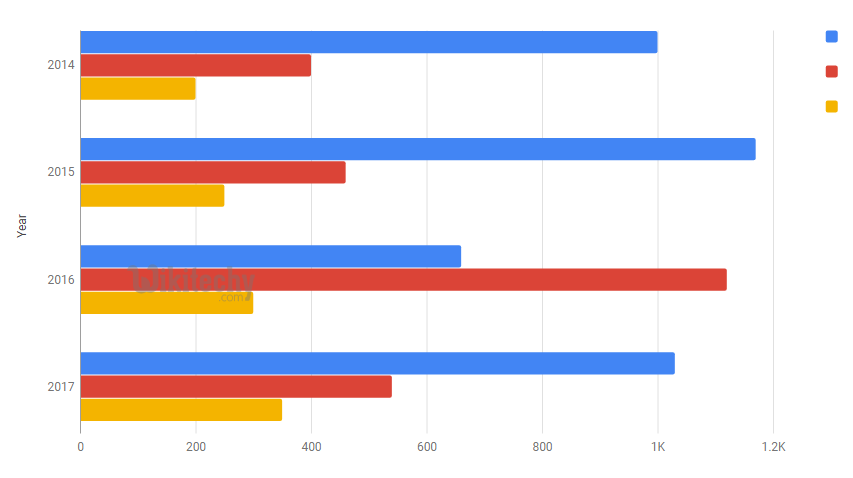
- Material Bar Charts have many small improvements over Classic Bar Charts, including an improved color palette, rounded corners, clearer label formatting, tighter default spacing between series, softer gridlines and titles (and the addition of subtitles).
Configurations:
- We've used Bar class to show material chart.
 Tryit<html>
<head>
<title>Google Charts Tutorial</title>
   <script type="text/javascript" src="https://www.gstatic.com/charts/loader.js"></script>
   <script type="text/javascript">
     google.charts.load('current', {packages: ['corechart','bar']});
   </script>
</head>
<body>
<div id="container" style="width: 550px; height: 400px; margin: 0 auto"></div>
<script language="JavaScript">
function drawChart() {
   // Define the chart to be drawn.
   var data = google.visualization.arrayToDataTable([
      ['Year', 'Asia', 'Europe'],
	  ['2012',  900,      390],
      ['2013',  1000,      400],
      ['2014',  1170,      440],
      ['2015',  1250,       480],
      ['2016',  1530,      540]
      ]);

   var options = {
      title: 'Population (in millions)',
      bars: 'horizontal'
   };

   // Instantiate and draw the chart.
   var chart = new google.charts.Bar(document.getElementById('container'));
   chart.draw(data, options);
}
google.charts.setOnLoadCallback(drawChart);
</script>
</body>
</html>
Clicking "Copy Code" button to copy the code. From - google charts tutorial - team
The Material Charts are in beta. The appearance and interactivity are largely final, but many of the options available in Classic Charts are not yet available in them. You can find a list of options that are not yet supported in this issue.
Also, the way options are declared is not finalized, so if you are using any of the classic options, you must convert them to material options by replacing this line:
chart.draw(data, options);
...with this:
chart.draw(data, google.charts.Bar.convertOptions(options));
- Using google.charts.Bar.convertOptions() allows you to take advantage of certain features, such as the hAxis/vAxis.format preset options.