Google Charts Tutorial - chart js - google graphs - google charts examples
Why charts ?
What is Google Charts?
- Google Charts is an interactive Web service that creates graphical charts from user-supplied information.
- Google Charts is pure JavaScript based charting library which is used to enhance web applications by adding interactive charting capability.
- Russell Heimlich

- Sole Developer at the Pew Research Center
- 3 Years at U.S.News & World Report
- Creator of Dummyimage.com
- Google Charts is a combination of two application programming interfaces (APIs) and they are Google Chart API and Google Visualization API.
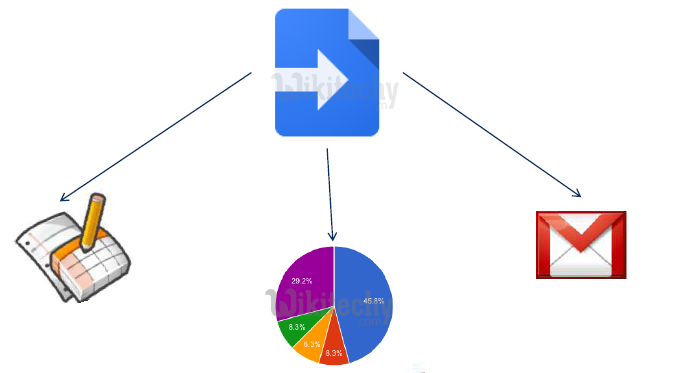
- Google Charts provides wide variety of charts like line chart, spline chart, area charts, bar charts, pie chart and many other charts are used in Google Charts.
- Google Charts are free to use charts library from Google which renders nice customizable charts which work on all platforms.

Learn google charts - google charts tutorial - google charts tutorial - google charts examples - google charts programs
Google Charts Pro :
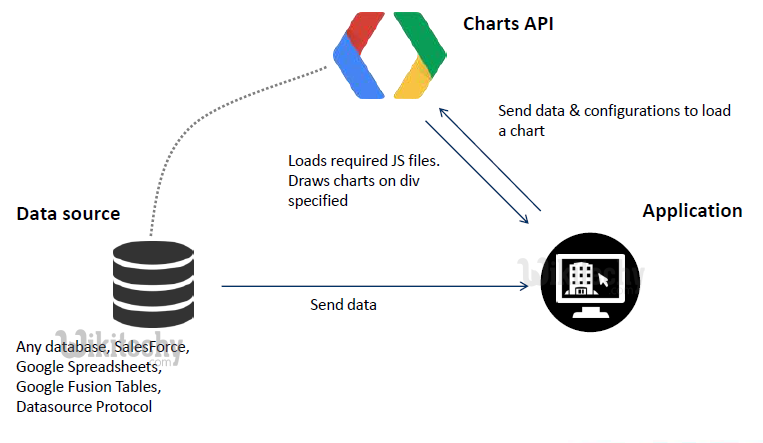
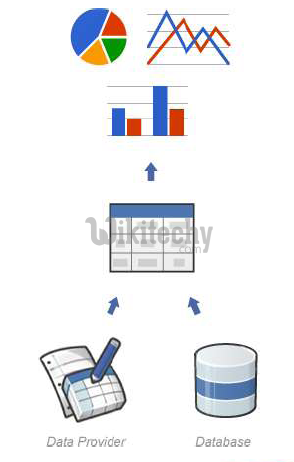
Google Charts Architecture - How Google Charts works
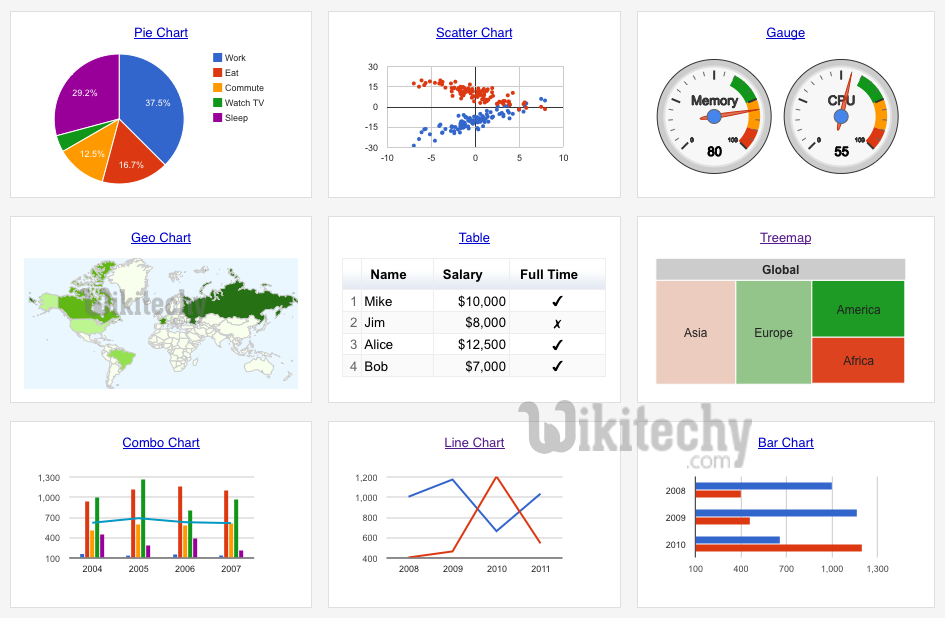
Types of Charts in Google Charts
- Area Charts - Area charts are used for drawing area based charts
- Bar Charts - Bar charts are used to draw bar chart
- Bubble Charts – Bubble Charts are used for bubble based charts
- Calendar Charts - Calendar charts are used for drawing activities over the course of long span of time like months or years.
- Candlestick Charts - Candlestick charts are used for displaying opening and closing value variance and are used for representing stocks
- Column Charts – Column Charts are used for drawing column based charts
- Combination Charts - Combination chart are used to rendering each series as a different marker type
- Histogram Charts - Histogram is a chart used for grouping numeric data into buckets and displaying the buckets as segmented columns.
- Line Charts – Line Charts are used for drawing line based charts
- Google Map Chart - Google Map Chart makes use of Google Maps API for displaying a Map.
- Pie Charts - Pie charts are used for drawing pie based charts.
- Sankey Charts - Sankey chart is a visualization tool which is used for depicting a flow from one set of values to another.
- Scatter Charts - Scatter Charts are used for drawing scatter based charts
- Stepped Area Charts - Stepped area chart is used to draw step based area chart
- Table Charts - Table chart allows rendering a table which can be sorted and paged.
- Timelines Charts - Timelines depicts how a set of resources are used over time.
- TreeMap Charts - TreeMap is basically a visual representation of a data tree, where each node can have zero or more children, and one parent.
- Trendlines Charts – Trendlines Chart is a chart which is overlaid on a chart to reveal the overall direction of the data.
Learn google charts - google charts tutorial - google charts - google charts examples - google charts programs
Google flowchart :
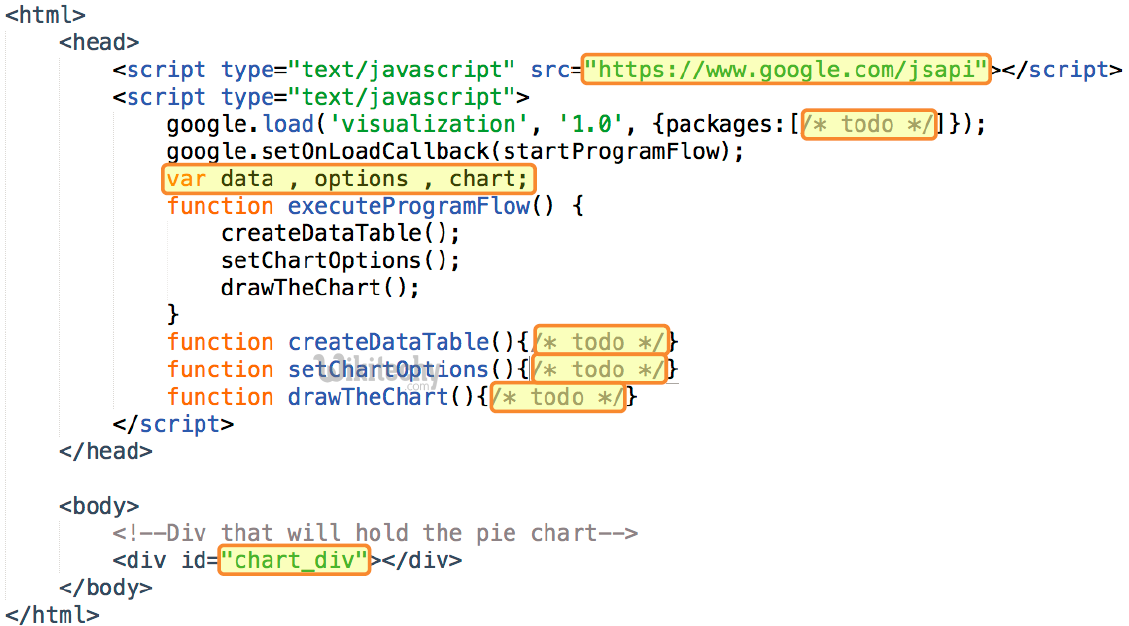
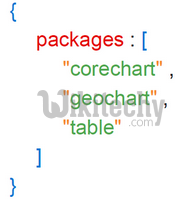
Declare chart packages :
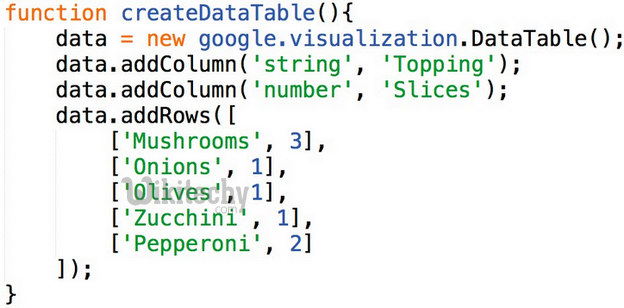
Create Data Set :
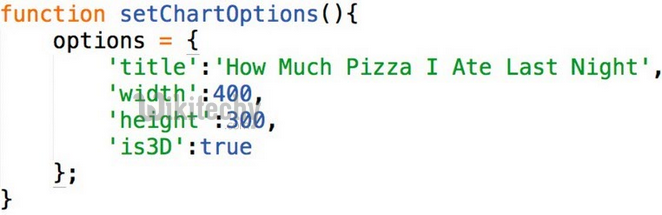
Set chart options:
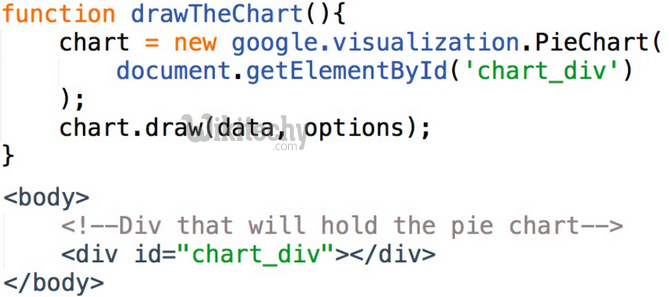
Draw the chart :
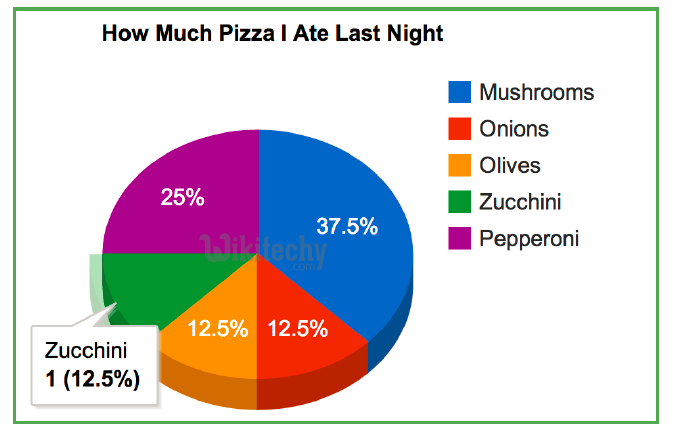
The chart :
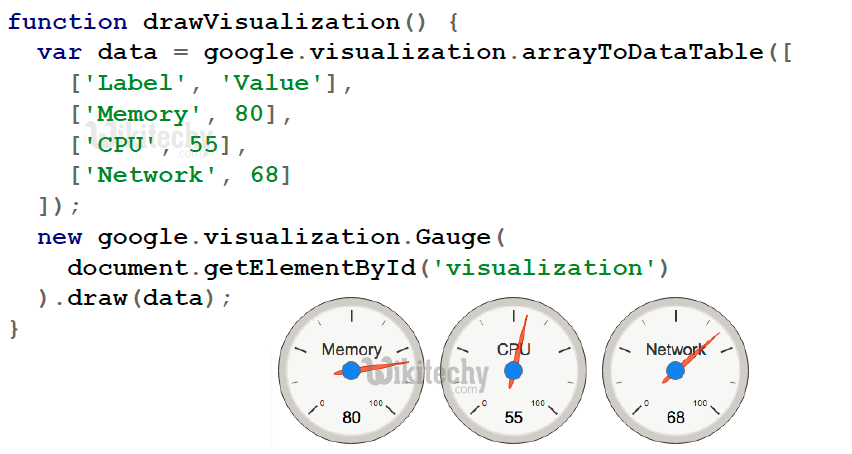
Google Charts - Gauge Example :
Google charts - Ad Ons - Overview