Google Charts - Google Charts tutorial - Learn Google Charts - chart js - google graphs - google charts examples
Learn Google Charts - How google charts works ?
Step 1: Initial Libraries to load
 <!--Load the AJAX API-->
<script src="http://www.google.com/jsapi"></script>
<script type="text/javascript">
// Load the Visualization API and the piechart package.
google.load('visualization', '1', {'packages':['corechart']});
// Set a callback to run when everything is loaded.
google.setOnLoadCallback(drawChart);
function drawChart() {
// MAGIC!
}
</script>
Clicking "Copy Code" button to copy the code. From - google charts tutorial - team
 <script type="text/javascript"
src="https://www.gstatic.com/charts/loader.js"></script>
<script type="text/javascript">
google.charts.load('current', {packages: ['corechart']});
...
</script>
Clicking "Copy Code" button to copy the code. From - google charts tutorial - team
What is a DataTable ?
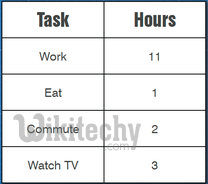
Step 2 : Making a DataTable - Prepare the data and populate the DataTable
- Create Empty Data Table and add columns and rows to it
- Use a JavaScript Literal Initializer
var data = new google.visualization.DataTable();
data.addColumn('string', 'Task');
data.addColumn('number', 'Hours');
data.addRows([
['Work', 11],
['Eat', 1],
['Commute', 2],
['Watch TV', 3]
]);
Clicking "Copy Code" button to copy the code. From - google charts tutorial - team
More Ways To Populate Data
// Create and populate the data table.
var data = new google.visualization.DataTable();
data.addColumn('string', 'Task');
data.addColumn('number', 'Hours per Day');
data.addRows(4);
data.setValue(0, 0, 'Work'); //row index, cell index, value
data.setValue(0, 1, 11);
data.setValue(1, 0, 'Eat');
data.setValue(1, 1, 1);
data.setValue(2, 0, 'Commute');
data.setValue(2, 1, 2);
data.setValue(3, 0, 'Watch TV');
data.setValue(3, 1, 3);
Clicking "Copy Code" button to copy the code. From - google charts tutorial - team
More ways - Populate the Data Table with Javascript
- You can pass a JavaScript literal object into your table constructor, defining the table schema and optionally data as well.
- Useful when generating data on your web server.
- Processes faster than other methods for larger tables (about 1,000+ cells)
- Syntax is tricky to get right, and prone to typos.
- Not very readable code.
- Temptingly similar, but not identical, to JSON.
 var data = new google.visualization.DataTable(
{
cols: [ {id: 'x', label: 'x', type: 'number' },
{id: 'Dogs', label: 'Dogs', type: 'number' } ],
rows: [ { c: [ {v: 0} , {v: 0} ] },
{ c: [ {v: 1} , {v: 10} ] },
{ c: [ {v: 2} , {v: 23} ] },
{ c: [ {v: 3} , {v: 17} ] },
{ c: [ {v: 4} , {v: 18} ] },
]
}
);
Clicking "Copy Code" button to copy the code. From - google charts tutorial - team
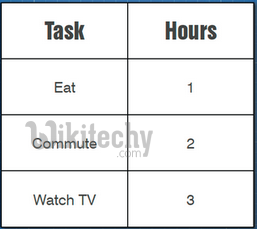
DataViews in google charts
Step 3 : Making A DataView
var view = new google.visualization.DataView(data);
view.setRows(
view.getFilteredRows([{
column:1,
maxValue:5
}])
);
Clicking "Copy Code" button to copy the code. From - google charts tutorial - team
Step 4 : Customize the chart by specifying options
var options = {
chart: {
title: 'Box Office Earnings in First Two Weeks of Opening',
subtitle: 'in millions of dollars (USD)'
},
width: 900,
height: 500,
vAxis: {
title: 'Amount Collected },
hAxis: {
title: 'Day' }
};
Clicking "Copy Code" button to copy the code. From - google charts tutorial - team
Step 5 : Draw the Chart - Instantiate the chart:
Each chart type is based on a different class, listed in the chart's documentation.Create instance of your chart with single parametervar chart = new google.visualization.PieChart(document.getElementById('chart_div'));Clicking "Copy Code" button to copy the code. From - google charts tutorial - team
Step 6 : Finally Draw your chart:
Once you have prepared your data and options, you can draw chart by following callchart.draw(myData, options);Clicking "Copy Code" button to copy the code. From - google charts tutorial - team
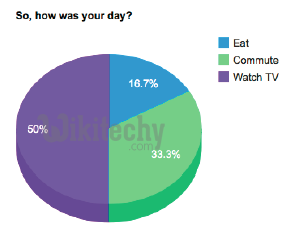
Step 7 : Pie Chart example
// Create and draw the visualization.
var target = document.getElementById('visualization');
new google.visualization.PieChart(target).draw(
view,
{title: ‘So, how was your day?’}
);
Clicking "Copy Code" button to copy the code. From - google charts tutorial - team
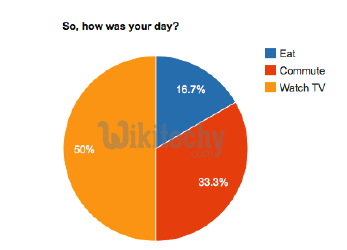
Step 5 : Pie Chart example - Add Properties
new google.visualization.PieChart(target).draw(
view,
{
title: ‘So, how was your day?’,
is3D: true,
colors: ['#0099ff', '#00ff99', '#9900ff']
}
);
Clicking "Copy Code" button to copy the code. From - google charts tutorial - team
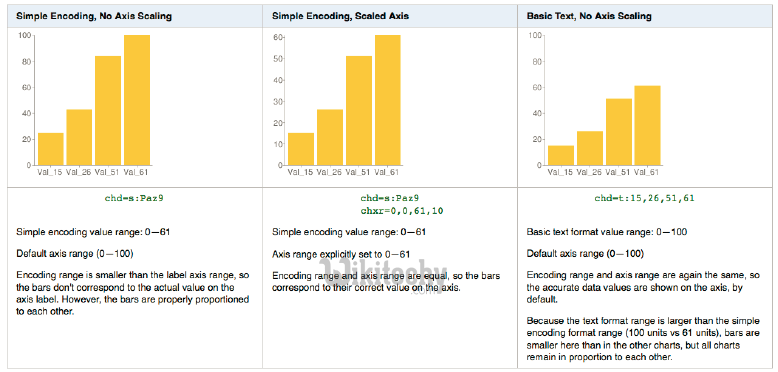
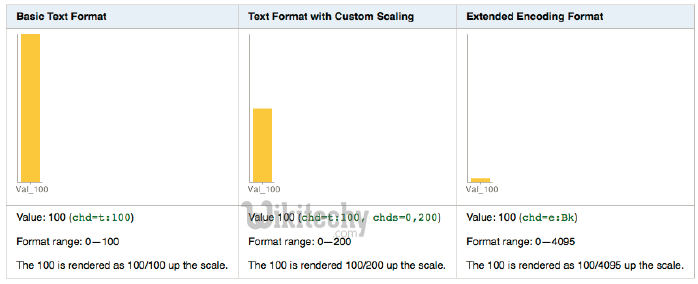
Data Formats supported by google charts
Basic Text Data Format
Google Charts - Basic Text Data Example
Google Charts - Simple Encoding Data Format
Simple Encoding Function
var simpleEncoding =
'ABCDEFGHIJKLMNOPQRSTUVWXYZabcdefghijklmnopqrstuvwxyz0123456789'
//Scales submitted values so that maxVal becomes the highest.
function simpleEncode(valueArray, maxValue) {
var chartData = ['s:'];
for (var i = 0; i < valueArray.length; i++) {
var currentValue = valueArray[i];
if (!isNaN(currentValue) && currentValue >= 0) {
chartData.push(simpleEncoding.charAt(
Math.round((simpleEncoding.length-1) *
currentValue / maxValue))
); }
else { chartData.push('_'); }
}
return chartData.join('');
}
Clicking "Copy Code" button to copy the code. From - google charts tutorial - team
Google Charts - Simple Encoding Example
Extended Data Format
Extended Encoding Function in Google Charts
Extended Encoding Example - Google Charts
Data Scaling in Google Charts
Axis Scaling - Google Charts
Axis Scaling Example - Google Charts