Google Charts - Google Charts tutorial - Pie Chart - chart js - google graphs - google charts examples
What is Pie Chart?
- A pie chart is a circular chart divided into wedge-like sectors, illustrating proportion.
- Each wedge represents a proportionate part of the whole, and the total value of the pie is always 100 percent.
- Pie charts can make the size of portions easy to understand at a glance.
- They're widely used in business presentations and education to show the proportions among a large variety of categories including expenses, segments of a population, or answers to a survey.

Learn Googlecharts - Googlecharts tutorial - pie chart graph in google charts - Googlecharts examples - Googlecharts programs
Pie Chart Types:
Pie charts are used to draw pie based charts. In this section we're going to discuss following types of pie based charts.
| Sr. No. | Chart Type / Description |
|---|---|
| 1 | Basic Pie Basic pie chart |
| 2 | Donut Chart Donut Chart |
| 3 | 3D Pie chart 3D Pie chart |
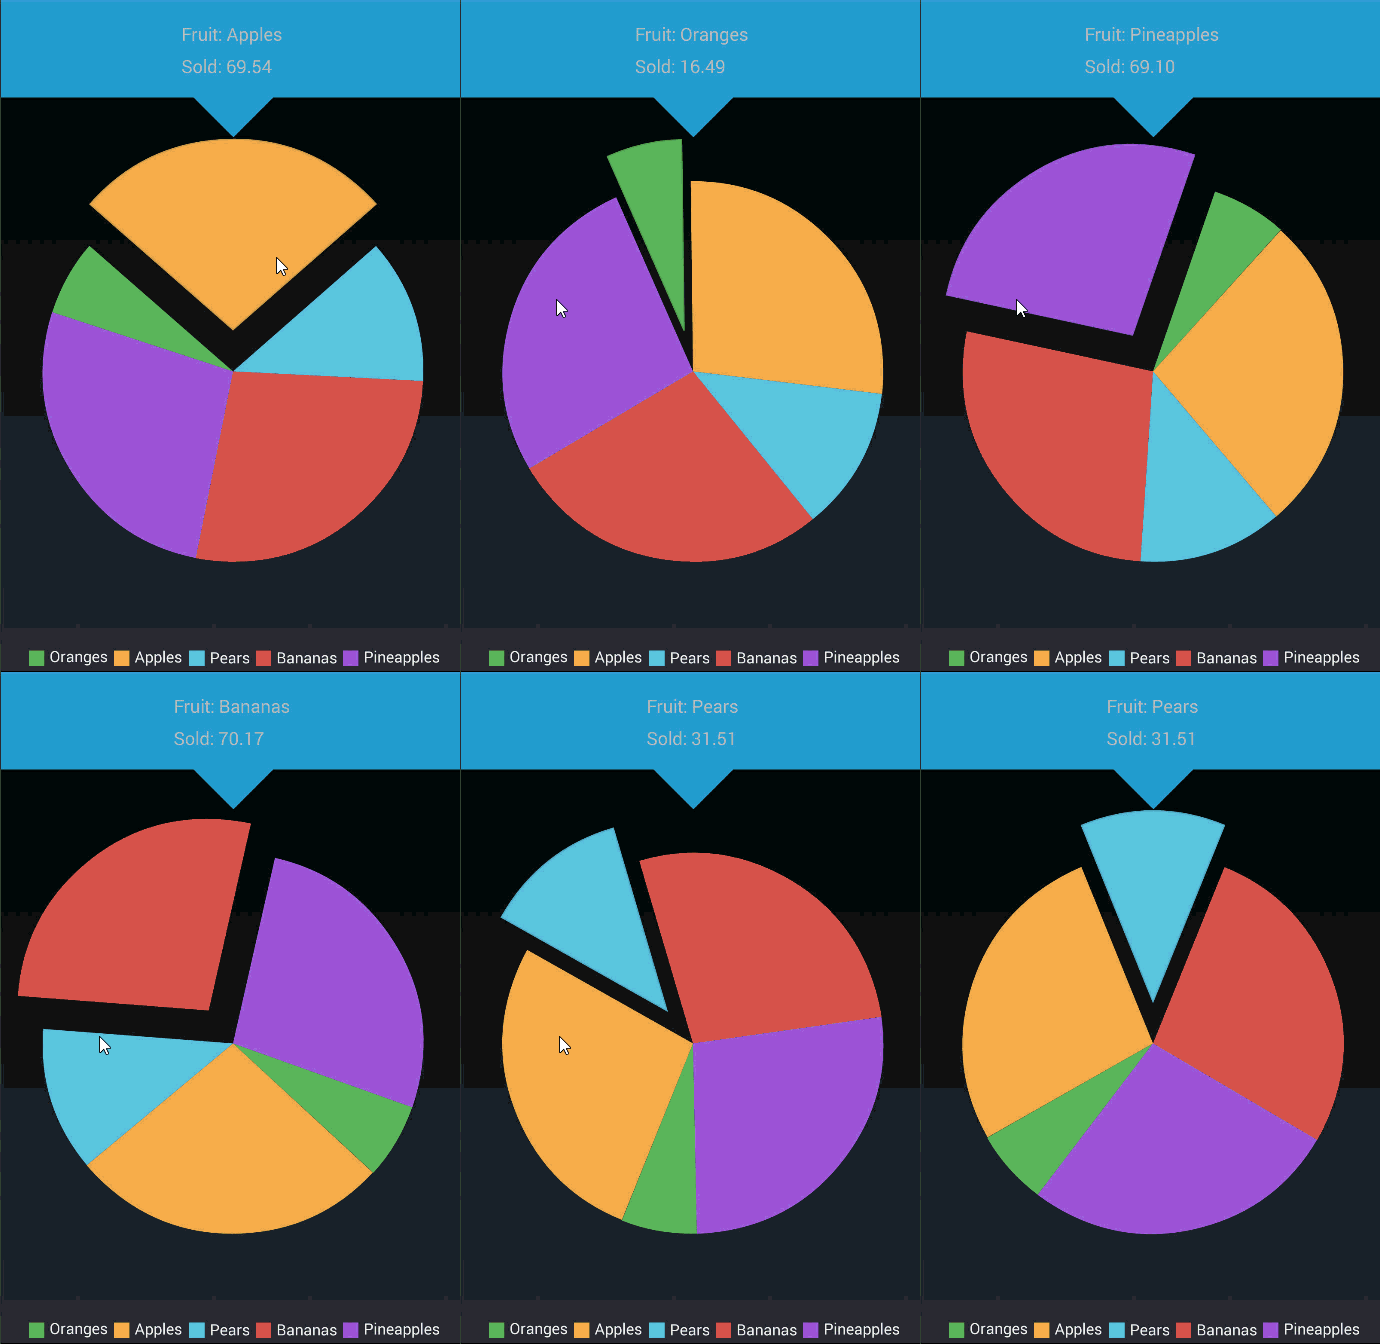
| 4 | Pie chart with exploded slices Pie chart with exploded slices |
