Google Charts - Google Charts tutorial - Area Charts - chart js - google graphs - google charts examples
What are area charts in Google Chart?
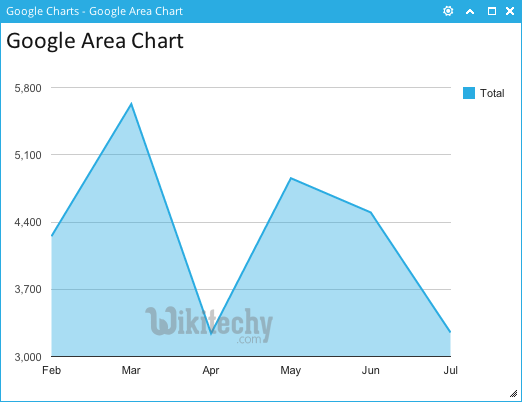
- Area Chart in Google Chart displays graphically Quantitative data and it is based on line chart
- Area chart are commonly emphasized with , colors , textures and hatchings
- Area charts represent cumulated totals using numbers or else percentages which is known as stacked area charts in this case which is done over time
- Area chart is used for showing trends over time which is done among related attributes.
- Area chart is a plot chart in which the plotted line is filled in with color to indicate the volume.
- Area charts use vertical and horizontal lines to connect the data points which is done in a series forming a step-like progression which are known as step-area charts.
- Area charts in data points are connected by smooth curves instead of straight lines are known as spline-area charts
- Area charts are used for drawing area based charts.
Learn google charts - google charts tutorial - google chart area charts - google charts examples - google charts programs
- The table which is below shows us the different types of chart and description.
| Sr.no | Chart type/Description |
|---|---|
| 1 | Basic Area |
| 2 | Area with negative values |
| 3 | Stacked area |
| 4 | Percentage area |
| 5 | Area with missing points |
| 6 | Inverted axes |