Google Charts - Google Charts tutorial - Histogram Chart - chart js - google graphs - google charts examples
What is Histogram?
A histogram is a graphical representation of the distribution of a dataset.
What is Histogram chart?
- A histogram is a chart that groups numeric data into buckets, displaying the buckets as segmented columns.
- They're used to depict the distribution of a dataset as how often values fall into ranges.
- Google Charts automatically chooses the number of buckets for you.
- All buckets are equal width and have a height proportional to the number of data points in the bucket.
- Histograms are similar to column charts in other aspects.
Learn Googlecharts - Googlecharts tutorial - graph view in histogram - Googlecharts examples - Googlecharts programs
| Sr. No. | Chart Type / Description |
|---|---|
| 1 | Basic Histogram Basic Histogram chart |
| 2 | Controlling Color Customized Color of Histrogram Chart |
| 3 | Controlling Buckets Customized Buckets of Histrogram Chart |
| 4 | Multiple Series Histrogram Chart having multiple series |
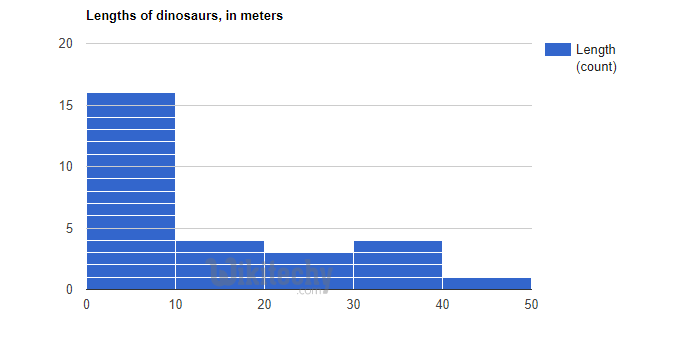
Google Histogram Chart:
 let options = Options(title = "Lengths of dinosaurs, in meters")

data
|> Chart.Histogram
|> Chart.WithOptions options
|> Chart.WithLabel "Length"