Google Charts - Google Charts tutorial - Stacked Bar Chart - chart js - google graphs - google charts examples
What is Stacked bar charts?
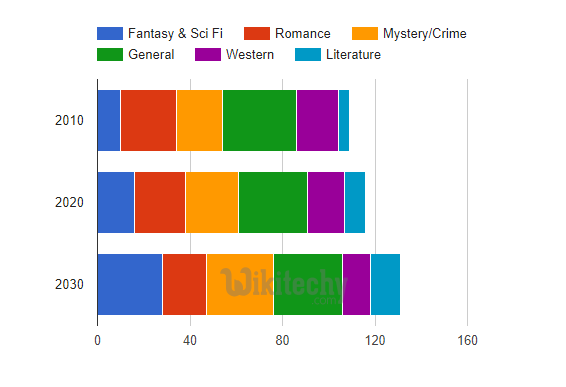
- A stacked bar chart is a bar chart that places related values atop one another.
- If there are any negative values, they are stacked in reverse order below the chart's axis baseline.
- Stacked bar charts are typically used when a category naturally divides into components.
- For instance, consider some hypothetical book sales, divided by genre and compared across time:
Learn google charts - google charts tutorial - stack bar chart - google charts examples - google charts programs
- Stacked bar charts also support 100% stacking, where the stacks of elements at each domain-value are rescaled such that they add up to 100%.
- The options for this are isStacked: 'percent', which formats each value as a percentage of 100%, and isStacked: 'relative', which formats each value as a fraction of 1.
- There is also an isStacked: 'absolute' option, which is functionally equivalent to isStacked: true.
Configurations
- We've used isStacked configuration to show stacked chart.
sample code
// Set chart options
var options = {
   isStacked: true
};
Clicking "Copy Code" button to copy the code. From - google charts tutorial - team
Sample Code
googlecharts_bar_stacked.html
 Tryit
<html>
<head>
<title>wikitechy Google Charts Tutorial</title>
   <script type="text/javascript" src="https://www.gstatic.com/charts/loader.js"></script>
   <script type="text/javascript">
     google.charts.load('current', {packages: ['corechart']});
   </script>
</head>
<body>
<div id="container" style="width: 550px; height: 400px; margin: 0 auto"></div>
<script language="JavaScript">
function drawChart() {
   // Define the chart to be drawn.
   var data = google.visualization.arrayToDataTable([
      ['Year', 'Asia', 'Europe'],
	  ['2012',  900,      390],
      ['2013',  1000,      400],
      ['2014',  1170,      440],
      ['2015',  1250,       480],
      ['2016',  1530,      540]
      ]);

   var options = {
      title: 'Population (in millions)',
      isStacked:true
   };

   // Instantiate and draw the chart.
   var chart = new google.visualization.BarChart(document.getElementById('container'));
   chart.draw(data, options);
}
google.charts.setOnLoadCallback(drawChart);
</script>
</body>
</html>