Google Charts - Google Charts tutorial - Area chart having negative values - chart js - google graphs - google charts examples
What is an Area chart?
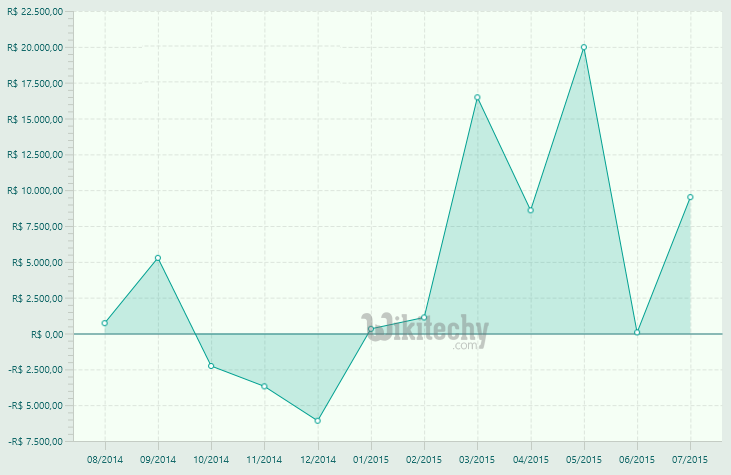
- Area Chart in Google Chart displays graphically Quantitative data and it is based on line chart
- Area chart are commonly emphasized with , colors , textures and hatchings
- Area chart is used for showing trends over time which is done among related attributes.
Learn google charts - google charts tutorial - area chart having negative values - google charts examples - google charts programs
Area chart having negative values
Configurations
- Here the code which is given below shows us the configuration for area chart having negatives value.
Sample Code:
//area chart
var chart = new google.visualization.AreaChart(document.getElementById('container'));
Clicking "Copy Code" button to copy the code. From - google charts tutorial - team
- The program which is given below shows us the full program of area chart having negative values is used.
Sample Code:
googlecharts-area-negative.html
 Tryit<html>
<head>
<title>Google Charts Tutorial</title>
   <script type="text/javascript" src="https://www.gstatic.com/charts/loader.js"></script>
   <script type="text/javascript">
     google.charts.load('current', {packages: ['corechart']});
   </script>
</head>
<body>
<div id="container" style="width: 550px; height: 400px; margin: 0 auto"></div>
<script language="JavaScript">
function drawChart() {
   // Define the chart to be drawn.
   var data = google.visualization.arrayToDataTable([
      ['Year', 'Sales', 'Expenses'],
      ['2013',  1000,      400],
      ['2014',  -1170,      460],
      ['2015',  -660,       1120],
      ['2016',  1030,      540]
      ]);
   var options = {
      isStacked: true,
      title: 'Population',
      hAxis: {
         title: 'Year',
         titleTextStyle: {
            color: '#333'
         }
      },
      vAxis: {
         minValue: 0
      }
   };
   // Instantiate and draw the chart.
   var chart = new google.visualization.AreaChart(document.getElementById('container'));
   chart.draw(data, options);
}
google.charts.setOnLoadCallback(drawChart);
</script>
</body>
</html>