Google Charts - Google Charts tutorial - What is Google Charts - chart js - google graphs - google charts examples
What is Google Charts?
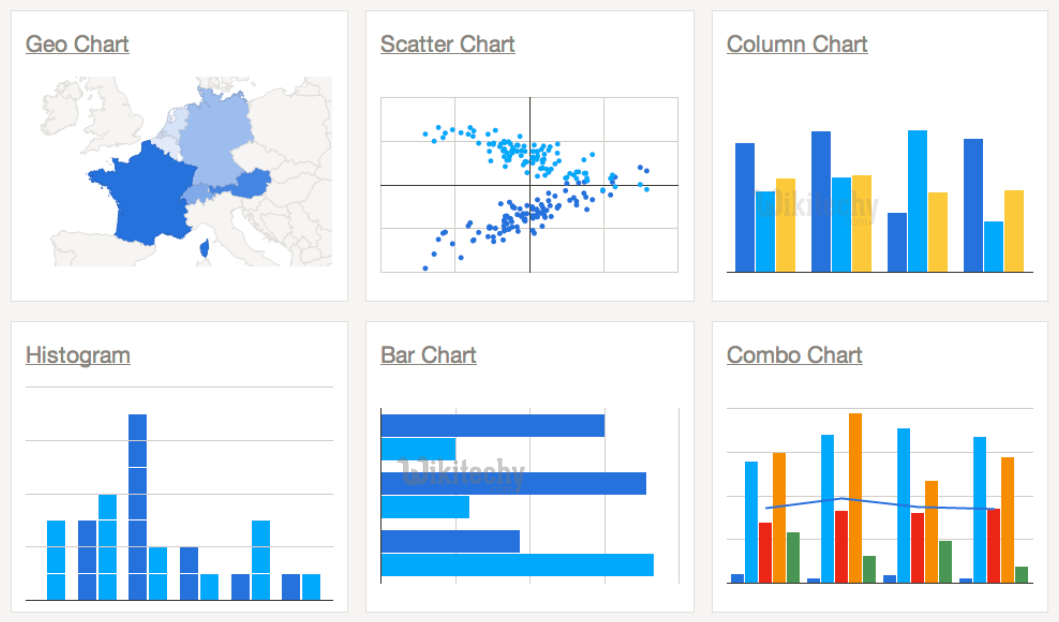
- Google Charts is a pure JavaScript based charting library which is done to enhance web applications by adding interactive charting capability.
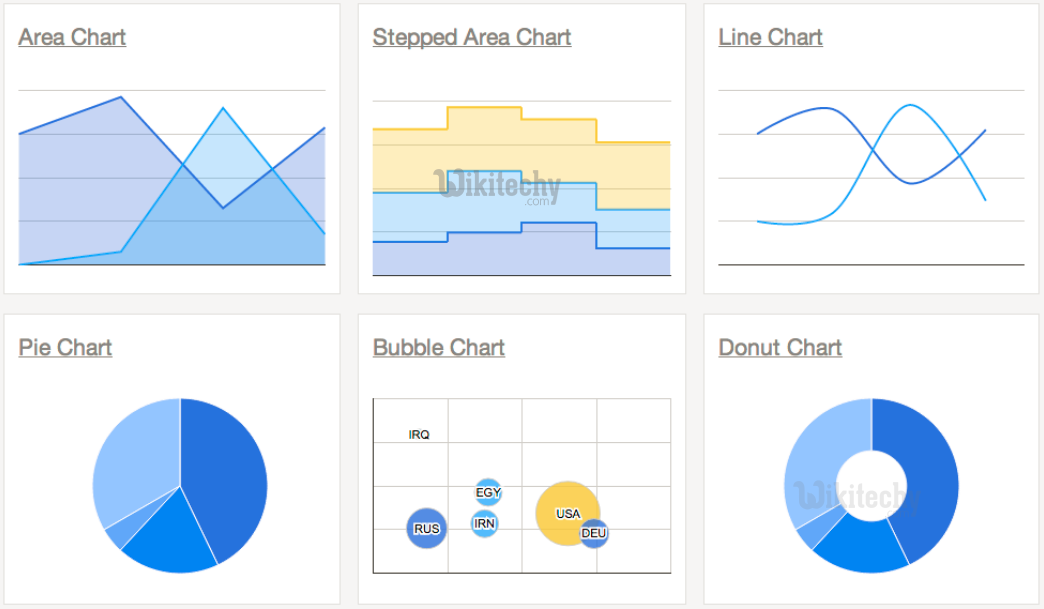
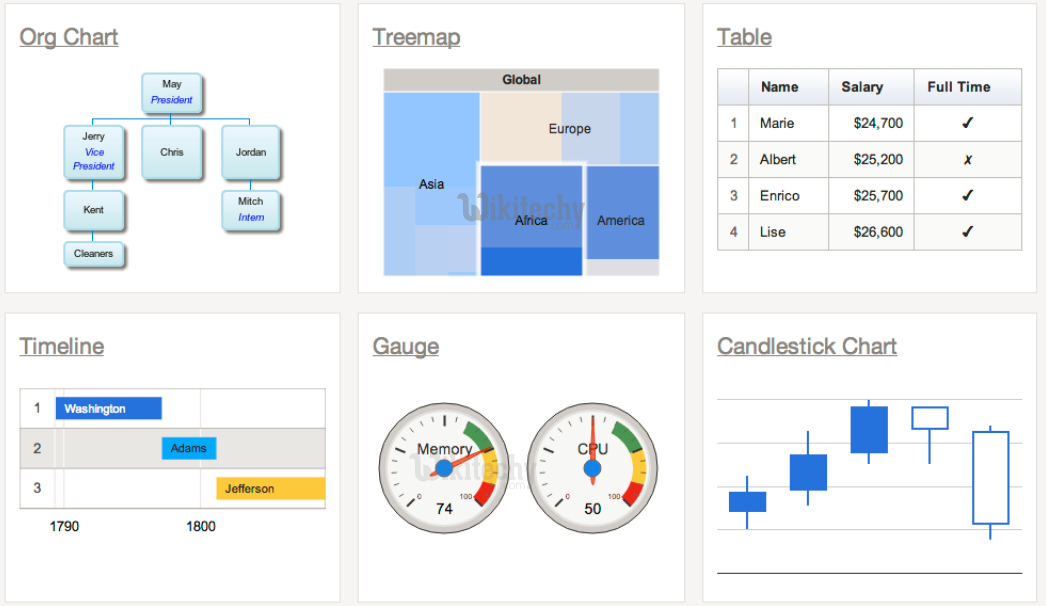
- Google Charts supports a wide range of charts like area charts , bar charts , pie charts and bubble charts .
- Google Charts are drawn using SVG in standard browsers like Chrome, Firefox, Safari, and Internet Explorer (IE).
- In Google Charts, VML (Vector Markup Language) is used to draw the graphics.
- Google Charts are exposed as JavaScript classes, and provides many chart types to use.
Learn Google chart - Google chart tutorial - Google chart examples - Google chart programs
What are the features of Google Charts?
- These are some of the salient features of Google Charts library.
- Compatability – It works seemlessly on all major browsers and on all kinds of mobile platforms like android and iOS.
- Multitouch Support - Supports multitouch on touch screen based platforms which are also known as mobile platforms like android and iOS and Ideal for iPhone/iPad and android based smart phones/ tablets.
- Free to Use – Google Chart is an Open source and is free to use for non-commercial purpose.
- Lightweight - loader.js core library in Google Charts is extremely lightweight library.
- Simple Configurations - Uses json to define various configuration of the charts and they are very easy to learn and easy to use as well.
- Dynamic - Allows modifying the chart even after chart generation is given.
- Multiple axes - Not restricted to x, y axis. Supports multiple axis on the charts.
- Configurable tooltips - Tooltip is used when a user is hover over any point on charts. Google charts provides tooltip inbuilt formatter or else callback formatter to control the tooltip programmatically.
- DateTime support – it handle date time specially and it also provides numerous inbuilt controls done over date wise categories.
- Print - Print the chart while using web page.
- External data – It supports loading data dynamically from the server and provides control over the data by using callback functions.
- Text Rotation - Supports rotation of labels which is done in any direction.
learn google charts - google charts tutorial -
google charts examples
- google charts code - google charts program - google charts download - google charts example
Advantages
- It is very Easy to learn and easy to use
- It is said to be interactive with mobile based android platforms
- It works on all modern browsers and all kinds of mobile platforms like android and iOS
- It Includes maps which is a part of google chart which is given and it is used as well
- We need not paid to use Google Charts and it is free for anyone to use.
- It can read from Excel, Google Spreadsheets, SQL databases, CSV files and it can auto update as well
Disadvantages
- It does not give us much customizability and also it does not give us other packages to use.
- It does not give us the sophisticated statistical processing done in Google Charts.
- If we need to use Google Charts, Network Connection is required.