Google Charts - Google Charts tutorial - Candlestick Charts - chart js - google graphs - google charts examples
What is Candle Stick Charts?
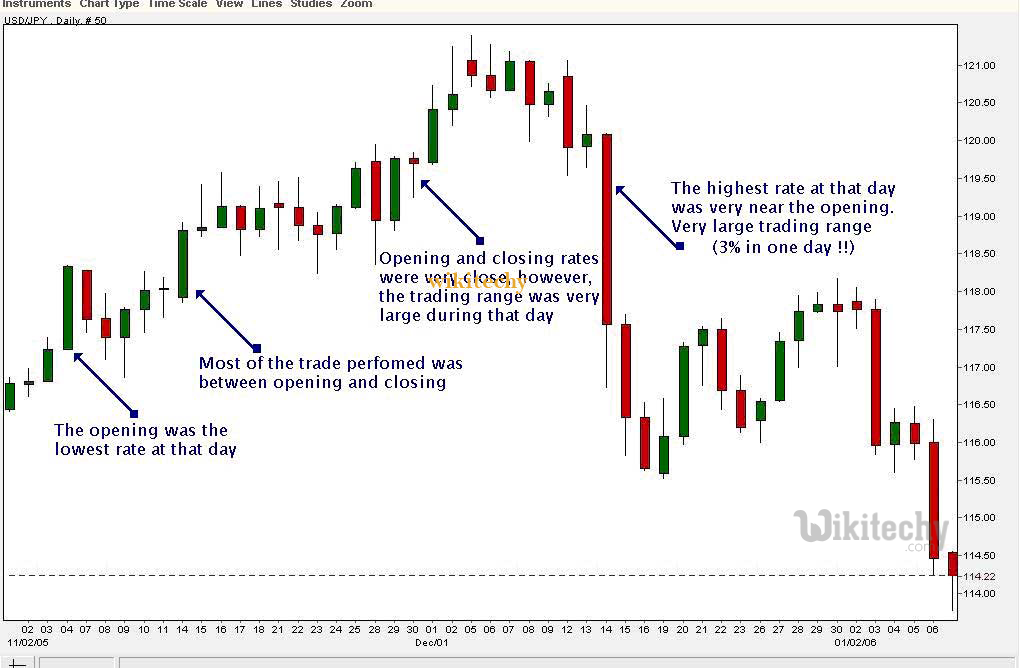
- A candlestick chart is mostly used to show an opening and closing value which are overlaid on top of a total variance.
- Candlestick charts are often used to show stocks value behavior.
- In this chart, filled boxes are drawn for items where the opening value is less than the closing value (a gain) and , and hollow boxes are drawn where the opening value of item is more than the closing value (a loss).
Learn - tutorial - candlestick chart graph in google charts - examples - programs
In this section we're going to discuss following types of candlestick charts.
| S. No. | Chart Type / Description |
|---|---|
| 1 | Basic Candlestick Basic Candlestick chart |
| 2 | Candlestick with customized colors Customized Candlestick Chart |
Configurations
We have used CandlestickChart class to show candlestick based chart.
//candlestick chart
var chart = new google.visualization.CandlestickChart(document.getElementById('container'));
Clicking "Copy Code" button to copy the code. From - google charts tutorial - team
Following is an example of a candlestick chart.
Example
 Tryit<html>
<head>
<title>Google Charts Tutorial</title>
   <script type="text/javascript" src="https://www.gstatic.com/charts/loader.js"></script>
   <script type="text/javascript">
     google.charts.load('current', {packages: ['corechart']});
   </script>
</head>
<body>
<div id="container" style="width: 550px; height: 400px; margin: 0 auto"></div>
<script language="JavaScript">
function drawChart() {
   // Define the chart to be drawn.
   var data = google.visualization.arrayToDataTable([
      ['Mon', 20, 28, 38, 45],
      ['Tue', 31, 38, 55, 66],
      ['Wed', 50, 55, 77, 80],
      ['Thu', 77, 77, 66, 50],
      ['Fri', 68, 66, 22, 15]
      // Treat first row as data as well.
    ], true);

   // Set chart options
   var options = {
      legend: 'none'
   };

   // Instantiate and draw the chart.
   var chart = new google.visualization.CandlestickChart(document.getElementById('container'));
   chart.draw(data, options);
}
google.charts.setOnLoadCallback(drawChart);
</script>
</body>
</html>