Google Charts - Google Charts tutorial - Calendar Charts - chart js - google graphs - google charts examples
What is Calendar chart?
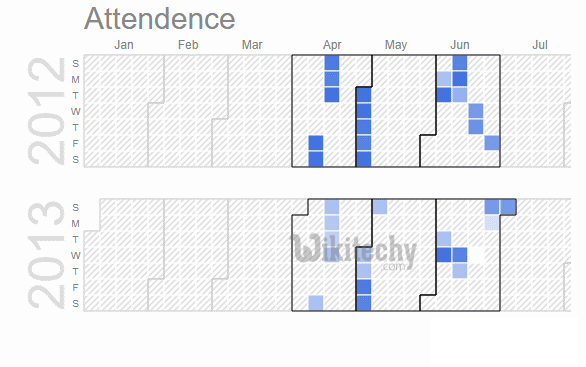
- A calendar chart is a visualization used to show activity over the course of a long span of time, such as months or years.
- They're best used when you want to illustrate how some quantity varies depending on the day of the week, or how it trends over time.
Chart Type:
| Sr. No. | Chart Type / Description |
|---|---|
| 1 | Basic Calendar Basic Calendar chart |
| 2 | Calendar with customized colors Customized Calendar Chart |
Example:
- Let's say we wanted to display how the attendance for a sports team varied throughout the season.
- With a calendar chart, we can use brightness to indicate the values and let people see trends at a glance:
Learn Google charts - Google charts tutorial - view of calendar charts in google chart - Google charts examples - Google charts programs
- You can mouse over the individual days to see the underlying data values.
- To create a calendar chart, load the calendar package and then create two columns, one for the dates and one for the values. (An optional third column for customized styling is coming in a future Google Charts release.)
- Then fill in your rows with date-value pairs, as shown below.
Sample Code:
 Tryit<html>
  <head>
    <script type="text/javascript" src="https://www.gstatic.com/charts/loader.js"></script>
    <script type="text/javascript">
      google.charts.load("current", {packages:["calendar"]});
      google.charts.setOnLoadCallback(drawChart);

   function drawChart() {
       var dataTable = new google.visualization.DataTable();
       dataTable.addColumn({ type: 'date', id: 'Date' });
       dataTable.addColumn({ type: 'number', id: 'Won/Loss' });
       dataTable.addRows([
          [ new Date(2012, 3, 13), 37032 ],
          [ new Date(2012, 3, 14), 38024 ],
          [ new Date(2012, 3, 15), 38024 ],
          [ new Date(2012, 3, 16), 38108 ],
          [ new Date(2012, 3, 17), 38229 ],
          // Many rows omitted for brevity.
          [ new Date(2013, 9, 4), 38177 ],
          [ new Date(2013, 9, 5), 38705 ],
          [ new Date(2013, 9, 12), 38210 ],
          [ new Date(2013, 9, 13), 38029 ],
          [ new Date(2013, 9, 19), 38823 ],
          [ new Date(2013, 9, 23), 38345 ],
          [ new Date(2013, 9, 24), 38436 ],
          [ new Date(2013, 9, 30), 38447 ]
        ]);

       var chart = new google.visualization.Calendar(document.getElementById('calendar_basic'));

       var options = {
         title: "Red Sox Attendance",
         height: 350,
       };

       chart.draw(dataTable, options);
   }
    </script>
  </head>
  <body>
    <div id="calendar_basic" style="width: 1000px; height: 350px;"></div>
  </body>
</html>