Google Charts - Google Charts tutorial - Basic Sankey Chart - chart js - google graphs - google charts examples
What is Basic Sankey Chart?
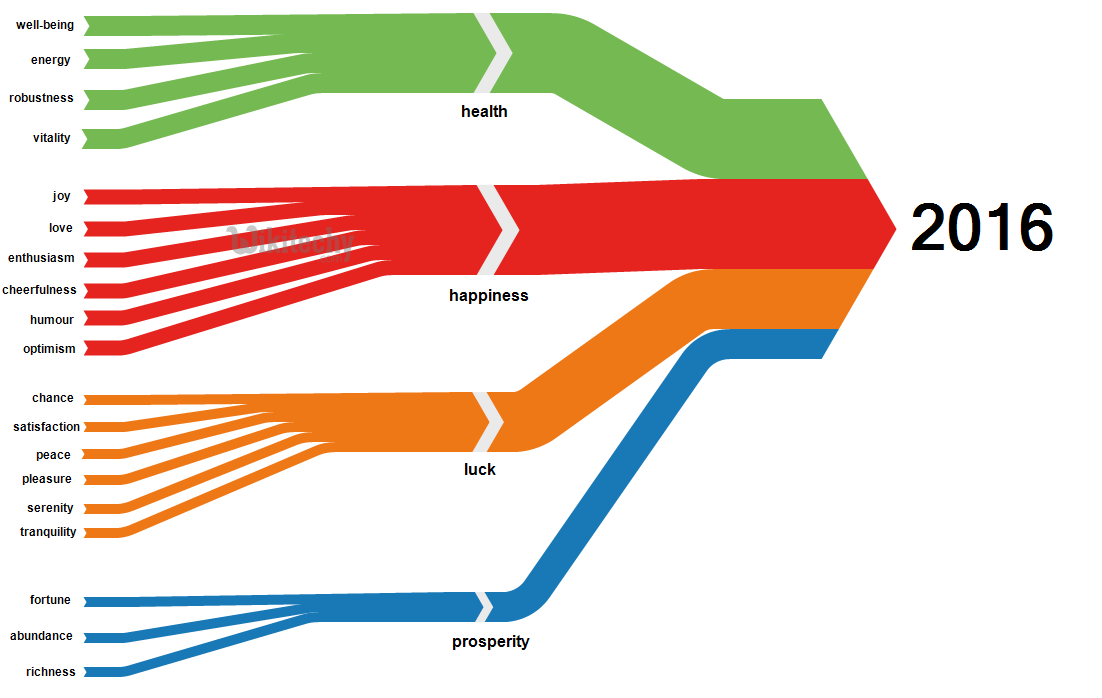
- Basic Sankey charts represent the flows of any kind, where the width of each flow is based on its quantity.
- Basic Sankey charts can be difficult to produce without specializing the software
- Basic Sankey charts are very good at showing particular kinds of complex information where the flows of energy from source to destination
- Basic Sankey chart is the flow chart where the Link thickness is proportional to the flow quantity.
- Basic Sankey Charts are the better way to illustrate which flows represent advantages and the flows are responsible for waste and emissions.
Learn google charts - google charts tutorial - google charts basic sankey chart - google charts examples - google charts programs
Configuration
- The syntax which is given below tell us about the configuration of basic Sankey Charts and we have used Sankey class to show Sankey Charts
Syntax:
//Map chart
var chart = new google.visualization.Sankey(document.getElementById('container'));
Clicking "Copy Code" button to copy the code. From - google charts tutorial - team
- The sample code which is given below show us the sample code for Basic Sankey chart
Sample Code
googlecharts-sankey-basic.html
 Tryit<html>
<head>
<title>Google Charts Tutorial</title>
   <script type="text/javascript" src="https://www.gstatic.com/charts/loader.js"></script>
   <script type="text/javascript" src="https://www.google.com/jsapi"></script>
   <script type="text/javascript">
     google.charts.load('current', {packages: ['sankey']});
   </script>
</head>
<body>
<div id="container" style="width: 550px; height: 400px; margin: 0 auto"></div>
<script language="JavaScript">
function drawChart() {
// Define the chart to be drawn.
   var data = new google.visualization.DataTable();
   data.addColumn('string', 'Start');
   data.addColumn('string', 'End');
   data.addColumn('number', 'Weight');
   data.addRows([
      [ 'New York', 'Paris', 4 ],
      [ 'New York', 'France', 2 ],
      [ 'New York', 'Spain', 3 ],
      [ 'New York', 'England', 6 ],
      [ 'Canada', 'Paris', 2 ],
      [ 'Canada', 'France', 4 ],
      [ 'Canada', 'England', 2 ],
      [ 'Los Angeles', 'Paris', 3 ],
      [ 'Los Angeles', 'France', 5 ],
      [ 'Los Angeles', 'Spain', 4 ],
      [ 'Los Angeles', 'England', 2 ],
      [ 'USA', 'Paris', 3 ],
      [ 'USA', 'France', 6 ],
      [ 'USA', 'Spain', 5 ],
      [ 'USA', 'England', 4 ]
   ]);

   // Set chart options
   var options = {
      width: 550
   };

   // Instantiate and draw the chart.
   var chart = new google.visualization.Sankey(document.getElementById('container'));
   chart.draw(data, options);
}
google.charts.setOnLoadCallback(drawChart);
</script>
</body>
</html>